Macro Minute: The Russian Gambit

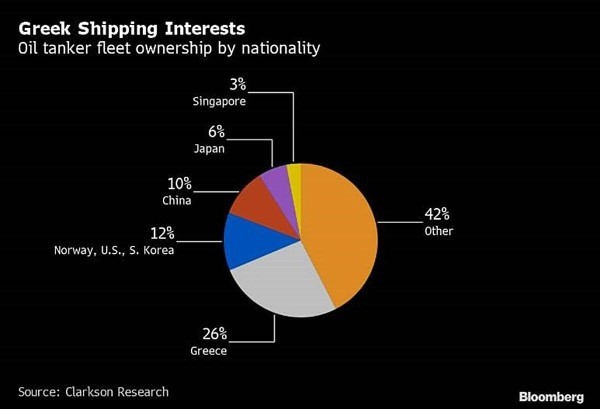
Last week, the European Union announced plans to ban Russian crude oil over the next six months and refined fuels by the end of the year as part of the sixth round of sanctions. Over the weekend, the proposed ban on its vessels transporting Russian oil to third-party countries was dropped, but the EU will retain a plan to prohibit insuring those shipments. Bloomberg reports that about 95% of the world’s tanker liability cover is arranged through a London-based organization that must heed European law. Without such insurance, Russia and its customers would have to find alternatives for risks, including oil spills and mishaps at sea, that can quickly run into multi-billion-dollar claims. (For more on the commodity trading business and how insurance impacts commodity flows, listen to “Javier Blas Explains How Commodity Trading Shops Really Work” on the Odd Lots Podcast).

The pain to European consumers is clear. The region last year got 27% of its oil imports and approximately 40% of gas from Russia (paying $104 billion for supplies of fossil fuels). Economists estimate a full embargo on Russian oil and gas reduces the area activity from 4% (Barclays) to 2% (Bundesbank), while some analysts have argued that the impact would be lower than that. Germany’s vice-chancellor Robert Habeck said his nation has already cut its reliance enough to make at least a full oil embargo manageable with the share of Russian crude in German imports falling to about 12% since the invasion.

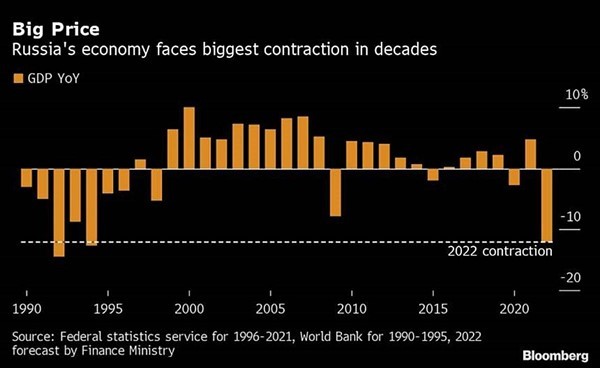
For Russia, an oil embargo would limit the inflow of foreign currency and make difficult spending cuts necessary. Russia’s Finance Ministry expects its GDP to shrink as much as 12% this year, on par with the turmoil seen in the early 1990s, when the Soviet Union ultimately dissolved. On Monday, Russia said it expects its oil production to rise in May, and that it is seeing new buyers for its crude, including in Asia. But how much of this is true and how much of it is just posturing?

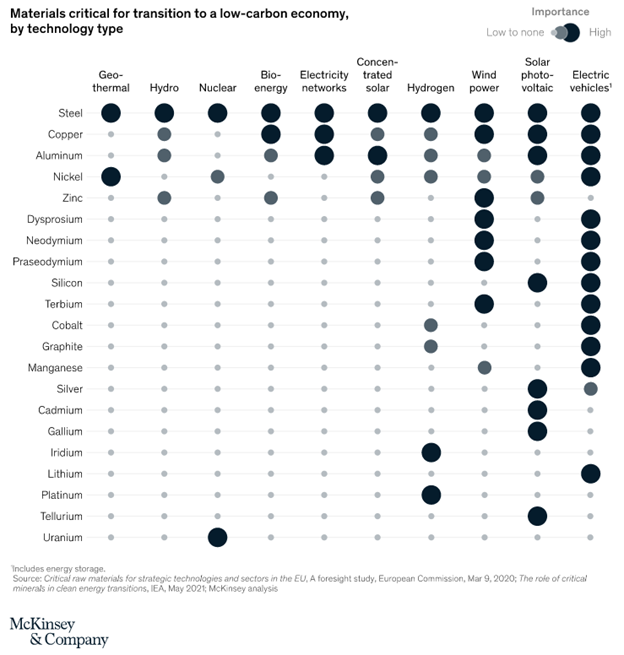
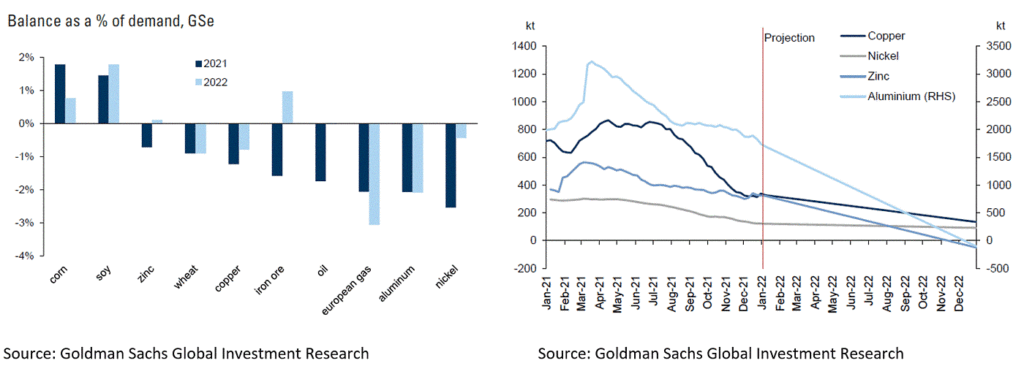
Changing oil shipping routes from Europe to Asia is not as trivial as Russia would lead us to believe. Different vessels are required to efficiently transport oil on different sea routes. When done properly, transport of crude oil by tankers is second only to pipelines in terms of efficiency, with the average cost of transport at $0.02 to $0.03 per gallon. When transporting oil, there are three main types of vessels: Very Large Crude Carriers / Ultra Large Crude Carriers, Suezmax, and Aframax vessels. There are about 800 VLCCs/ULCCs in the world used for long-haul routes and they carry around 2 million barrels each. There are about 700 Suezmax vessels capable of passing through the Suez Canal in a laden condition, and they can carry around 1 million barrels on long-haul routes. Lastly, there are about 600 Aframax carriers in the world, known as “go-fast boats,” moving about 600,000 barrels on short-haul routes.

Zoltan Pozsar of Credit Suisse estimates that roughly 1.3 million barrels of oil get shipped from Primorsk and Ust Luga to Europe on Aframax carriers and these journeys take a week or two to complete. Russia does not have pipelines to Asia so the only way to sell its product to new buyers is by using sea routes. However, it is uneconomical to transport crude on long-haul voyages on Aframax carriers and they would need more VLCCs/ULCCs to make that happen. Because Russian ports are not deep enough to dock VLCCs/ULCCs, they would first need to use Aframax vessels to get to a port to then transfer the crude to larger vessels. This transfer itself can takes weeks. After the transfer, the larger vessel would then take about 70 days to get to Asia, unload, and take a similar amount of time to return. This compares with just a couple of weeks when shipping to Europe. This would cause a sharp slowdown in Russia’s economic activity. The world would also need an extra 80 VLCCs/ULCCs to accommodate that change which represents 10% of the current global capacity of those vessels. Additionally, this only accounts for the re-routing of one product, oil, but Russia exports every major commodity.

The increasing competition for selling oil in Asia would have an impact on one of the Middle East’s biggest consumers. It is then no surprise that Saudi Arabia cut oil prices for Asia buyers over the weekend. This will not make Russia’s situation any easier. China benefits when Russia becomes weaker and more isolated and hence more dependent on Chinese goodwill. Let’s not forget that during Russia’s invasion of Crimea in 2014, China got Russia to agree to build (and possibly pay for) a dedicated pipeline at lower prices than it sells to Germany, even when the cost of gas from the new field is higher.

The cost of banning Russian oil might be large for Europe, but it can be even larger for Russia. This should increase the impact of sanctions and diminish the possibility of a unilateral cut in supply in the near future. 

Macro Minute: Inequality and Economic Growth

On a macroeconomic level, inequality can affect economic growth, productivity, and political stability, which in turn has direct implications for corporate profitability.

As with most social science endeavors, there is a healthy debate about the precise impact of inequality on growth. For starters, does it hinder or accelerate economic growth? Economic theory shows that with higher income and wealth come higher savings rates and, therefore, a higher level of investment and gross domestic product. In this case, if marginal productivity is higher for capital than for labor, one can see that more inequality would create higher economic growth. Also, in economies with underdeveloped credit markets, significant investments can only be made if wealth is accumulated. In the presence of imperfect capital markets and indivisibility of investments, an economy with higher levels of inequality may be able to introduce new industries, technologies, and markets and ultimately grow faster than the same economy with lower levels of inequality. Finally, there is an argument that reducing inequality reduces incentives to accumulate wealth through labor, entrepreneurship, and innovation, having, therefore, a negative impact on long-term growth.

However, a healthy debate should not be confused with a balanced debate. The bulk of the literature supports the theory that inequality hurts economic growth. Studies that found a positive relationship between inequality and growth were focused on the short term, and studies that found a negative relationship were focused on the long term. In other words, inequality can produce a small contribution to growth in the short term but will substantially adversely affect growth in the long term. Empirical results have increasingly supported the arguments for impaired economic growth and a negative impact on productivity in the face of rising inequality.

Poor people without access to credit markets often defer health care treatments, cannot procure housing or transportation and lack the means to further their education. This results in missed opportunities and diminished productivity and growth potential. The same applies to poor parents with multiple children compared to wealthy parents with few children. The inability of low-income families to invest in their children’s education, and the inability of poor workers to invest in developing job skills because of either financial constraints or time constraints while working multiple jobs, can result in a reduction in overall skills and knowledge of the potential employee pool. That can have a drag on growth, productivity, and business performance. Finally, there is the problem of the indivisibility of consumption. In the absence of developed credit markets, expensive items can only be acquired by accumulating wealth. If the economy became more equitable, part of the population initially excluded from the acquisition of these goods would enter the market, encouraging the creation of new domestic industries.

Societies with higher levels of inequality also tend to have higher levels of crime, keeping a larger share of the labor force from productive activities and decreasing potential growth. Also, with the increase in social instability, trust and social cohesion can erode, leading to conflict, political crises, and the resulting retraction of investments. One of the potential consequences is the rise of nationalism and the splintering of support for globalization. This scenario has played out in economies around the world over generations. Ray Dalio, the founder of Bridgewater Associates, the world’s largest hedge fund, has warned of the corrosive effects of inequality on faith in capitalism and, therefore, the stability of the institutions and markets in which business operates.*

*This excerpt appeared in the article “Business Risks Stemming from Socio-Economic Inequality” by Todd Cort, Stephen Park, and Decio Nascimento at the Columbia Law School Blue Sky Blog published on April 15, 2022. The article is based on the paper “Disclosure of Corporate Risk from Socio-Economic Inequality” by the same authors published on March 18, 2022. You can find the article here, and the paper here.

Macro Minute: A Phoenix From the Ashes

While we normally use this section to discuss macroeconomic concepts that help frame our top-down asset allocation views, or to present bottom-up macro asset analysis, today we are highlighting a company that stands out in a world of higher commodity prices.

At present, there is much discussion on how legacy companies, particularly in the commodity space, must change how they do business to adapt to a sustainability-focused world. There is currently a plethora of negative attention on fossil fuel companies as CEOs go before Congress, but today we’re focused on a company that is seven years removed from an activist campaign and fresh off an upgrade from high yield to investment grade last December.

Alcoa is the fifth largest aluminum “pure player” globally, and the largest upstream producer in the Western world. Its operations are geographically diverse, with an integrated aluminum production business from bauxite and alumina procurement and processing, to smelting.

Aluminum is a critical input to virtually every aspect of the forthcoming renewable energy complex and is often referred to as solid electricity given the sheer amount of power (and carbon intensity) required to process the metal.

By our estimates, global aluminum balances are expected to persist in deficit for at least the next 2-3 years, which is already being reflected on exchanges; LME aluminum inventories are running 40% below their five-year average. 

75% of Alcoa’s smelting capacity is powered by renewable energy, which positions the company as one of the least emitting players in a highly energy-intensive sector.

Alcoa is naturally leveraged to aluminum prices and has been consistently delivering on cash flow generation due to a disciplined capital allocation strategy focused on rationalizing its asset base and deleveraging. The company has also been quick to target green growth initiatives with an emphasis on low-carbon aluminum products, helping to differentiate the company from its peers. Some analysts believe that one such peer, Rusal, is expected to see aluminum production go to zero in 2022 due to Russian sanctions precluding the import of bauxite and alumina, which should have a positive impact on Alcoa’s market share.

In our view, Alcoa is a good example of a legacy company from an old-fashioned industry that has increasingly gained investor interest, not only due to the quality of the company’s management but also from a positive industry backdrop (e.g., green transition, supply imbalance).

Macro Minute: The Reflexivity of Inflation and Conflict

In The Changing World Order, Dalio makes the point that history shows us that empires follow a predictable cycle of rising and decline that he termed Big Cycle. The cycle starts at “The Rise” phase when there is strong leadership, education, character, civility, and work ethic development. Innovation is also enhanced by being open to the best thinking in the world. This combination increases productivity, competitiveness, and income. At “The Top”, the country moves from “growing the pie” to “splitting the pie”. While the country enjoys higher standards of living, people get used to doing well and enjoy more leisure time in detriment of hard work. Financial gains come unevenly, and the elites influence the political system to their advantage creating wealth, value, and political gaps. Borrowing grows to make up for the loss in productivity, weakening its financial health. “The Decline” happens when debt is large and there is an economic downturn leaving the country two choices: default or printing new money. Typically, countries opt for new money. The faster the printing occurs, the faster the deflationary gaps close and worrying about inflation begins.

It is clear that major wars are greatly inflationary, and even minor conflicts can interrupt trade, causing disruptions and increasing prices. But what we’re finding out is, inflation actually precedes periods of war or economic warfare.

It should come as no surprise then that the global increase in general prices along with a strong price increase of commodities is leading the world to a new era of conflict. Ukraine and Russia are not just material in the global trade of wheat but now also make up close to 20% of the world corn trade. A prolonged conflict can lead to issues this spring when planting starts causing significant productions shortfalls when harvest comes later this year, causing prices to go higher, increasing the risk of an escalation and conflict. This self-reinforcing process we see between inflation and conflict has a name, reflexivity. [1]

[1]The theory of reflexivity in financial markets was proposed by George Soros. Considered by most as one of the best macro investors in history, delivering an average annualized net return of 33% from 1970 to 2020. His work around the theory of reflexivity first appeared in his 1987 book “The Alchemy of Finance”. Soros’ theory of reflexivity is based around human fallibility—human beings can be wrong in their beliefs about the world and therefore act based on misguided knowledge. Heavily influenced by Karl Popper’s account of the scientific method (Popper was Soros’ tutor at the LSE), Soros argues that when the subject of study involves thinking participants, the scientific method must be changed to account for that fact. When thinking participants try to understand a situation, the independent variable is the situation. And when participants try to make an impact on the situation, the independent variable is participants’ views. Reflexivity occurs when the participant’s view of the world influences the events in the world, and these same events will influence the participants’ view of the world. When reflexivity is in play, it can cause boom/bust processes—self-reinforcement that eventually becomes self-defeating. For a detailed description of reflexivity and the construction of social reality, read “When Functions Collide” at https://www.norburypartners.com/nascimento-decio-when-functions-collide/

Macro Minute: Inequality and Monetary Policy

On February 1st, at Credit Suisse’s 2022 Latin America Investment Conference, Enio Shinohara moderated a conversation with Rogerio Xavier from SPX and Luis Stuhlberger from Fundo Verde. In it, Luis made a very interesting remark on the US interest rates curve, which loosely translates from Portuguese to “so far in the United States, the increase in interest rates being priced by the market has simply anticipated a series of hikes, but has not changed the terminal interest rate. In other words, the first probability that appeared during the pandemic was for the first hike to happen in 2023 or 2024. In the past year, these expectations were repeatedly pulled forward. It started with one hike in 2022, and now we are talking about 5 to 6 hikes of 25 bps in 2022. But the terminal interest rate has not changed; the terminal interest rate is around 1.80%. In my opinion, and I agree with Rogerio, this will not be enough.” (I highly recommend watching the entire conversation, especially if you have any interest in Brazil: English LinkPortuguese Link).

Central banks around the world have one big problem today – inflation. This issue is even more apparent in developed markets that are mostly seen as behind the curve. From traditional macroeconomic models, we know that central banks can restrict the supply of money to ease pricing pressures; however, there are a few ways that this can be achieved. The two most common approaches are hiking short-term interest rates and pressuring long-term rates higher, both with meaningful, but different, redistribution effects. Historically, hiking short-term rates has been the method of choice at the Fed. That was also communicated at the last FOMC meeting and markets are pricing for it. Nevertheless, the situation is fluid and central banks, especially the Fed, may conclude that influencing long-term rates might be a better tool for the current environment and their updated mandate that now includes improving inequality.

The traditional way of relying on short-term interest rate hikes to lower inflation has the effect of controlling prices of goods by curbing demand through a flat or inverted interest rates curve, thereby causing a recession that generates the necessary slack to keep prices from rising. This method acts through raising unemployment and having little effect on asset prices. As Luis mentioned, hikes have only been anticipated with minimal impact on long-term rates, which in turn had little effect on mortgage rates and equities. In other words, this method exacerbates inequality. This is what the market is pricing today, with forwards implying an inverted curve in the US and Europe one year from now.

We believe that once this becomes apparent, the Fed will move into a more aggressive posture regarding balance-sheet reduction and steepening of the yield curve. Central banks have tools to control term premia, and by doing so can influence mortgage rates and asset prices. By increasing mortgage rates, they can keep home prices in check and consequently OER, with the added bonus of improving affordability. By decreasing asset prices, they might be able to bring early retirees back into the labor force (due to the decreasing values of their nest eggs), slowing, but not reversing wage growth, and consequently keeping services inflation tamed. Since we are not going through a balance-sheet crisis, central banks can engineer a soft landing without killing growth by pressuring long-term rates higher. This method would potentially have a positive impact on inequality. We hold a strong view that the probability of this scenario is higher than what the market is pricing.

Macro Minute: Speak Harshly and Carry a Small Stick

In the early 1900s, President Theodore Roosevelt was known for the aphorism “Speak Softly and Carry a Big Stick.” The idea behind this adage is that it is the availability of raw power, not the use of it, that makes for effective diplomacy. In the case of Roosevelt, that policy worked very well. His two terms in office had been almost completely without conflict. “He has managed, without so much as firing one American pistol, to elevate his country to the giddy heights of world power.” – Literary Digest, December 22, 1906

Possibly empowered by the policy success almost 100 years earlier, in the early 2000s, the Fed decided to embark on a policy of forward guidance. Forward guidance is the act of communicating to the public the future course of monetary policy, namely, the path of interest rates. Said guidance, which along with the control of short-term interest rates and quantitative easing, had the aim of controlling the interest rate curve without so much as “firing one American pistol.” In hindsight, it worked. Forward guidance not only kept interest rates low through the expectations channel, but also helped dampen interest rate volatility (and along with that, equity and fx volatility).

However, the deflationary forces that provided the Fed with the availability of raw power began to dissipate around 2015. Raw power allows the Fed to introduce QE and rate hikes without needing to backtrack. This was ultimately eliminated once Covid incited a degree of globally coordinated fiscal and monetary policy never seen before. Since then, the Fed has flipped Roosevelt’s policy on its head. Today, the Fed is using FOMC press conferences and governors’ speeches to speak harshly on inflation. But when the time to act comes, we believe that the Fed does not have the same firepower as before. On one hand, it cannot materially tighten financial conditions without causing an enormous problem for the refinancing of historically high levels of debt (both corporate and government). On the other hand, with inflation rampant, it cannot continue to serve as a backstop to financial markets.

Going forward we believe that the Fed will speak harshly of inflation, but will consistently be behind the curve, possibly un-anchoring inflation expectations and the long end of the interest rates curve.

Macro Minute: Commodities in 2022

After a strong year, we believe 2022 is shaping up to be another good year for commodities. The theme across most sectors in the asset class is consistent – a fundamental mismatch between supply and demand is driving prices higher. Prices are being further pressured by increasing costs of capital for some (e.g., energy producers), higher input costs for others (e.g., fertilizer for agricultural products), and/or after a decade of underinvestment, a lack of new projects ready to boost supply (e.g., base metals mines). Any weakness in a historically strong USD will further the dollar-denominated sector’s move higher.

Looking across the asset class, one finds inventories of many commodities well below their 5-year averages entering 2022.

Concurrently, JP Morgan projects global investment in commodity sectors to be the lowest across all sectors this year. This comes at a time where the forces of ESG have driven costs of capital higher, leading major producers of commodities to hold off on investing until higher prices are sustained for a longer period.

Fundamentally, physical assets are driven by volumetric levels rather than expectations, which fuel financial assets. When supply cannot meet demand, and inventories cannot bridge that gap, only the highest bidders get access to a specific commodity. This process is called “demand destruction” and can produce parabolic price movements.

This past year, we saw an example of “demand destruction” price action in European natural gas (TTF). Weather seasonality impacted a very inelastic demand while shifting energy priorities related to net-zero goals, and regional geopolitics caused a shift on the supply side.

We expect to see more demand destruction across the commodities complex in 2022.

Macro Minute: Cross-Asset Views for 2022

Rather than provide a classic “Here are 10 things to watch” list that will more than likely be stale by the time you hear from us next, we’ll share quick views across different markets for 2022.

Equities

At a $3 trillion market cap, Apple is worth more than two years of Brazilian GDP or about equal to the United Kingdom’s GDP in 2020. Put simply, equities (particularly in the US) screen expensive by almost any metric. There are still opportunities to be had here, especially in companies levered to commodities, but with rates rising and Fed QT on the horizon, we are cautious on the asset class.

Commodities

The 2022 Norbury Partners Annual Report will be focused on commodities and a regime shift from an equity-driven market to one driven by commodities, but in brief, we think that decades of underinvestment across the complex, coupled with an increase in demand ex-China will be a boon for commodity prices. Commodities are essential to human life in a way incomparable to other financial assets. There is a strong case to be made that the sector will be a key piece of the geopolitical framework this decade (e.g., Russia, Kazakhstan, China).

Rates

We continue to monitor US interest rates with the view that they should persist moving higher from here and that the curve should steepen. While less clear on the number or pace of rate hikes this year, this paper from the Kansas City Fed (published October 2021) sheds some insight into how the Fed is thinking about policy normalization this time around.

Fewer hikes coupled with a bigger unwind of the balance sheet would in theory not only steepen the yield curve, but also allow banks (who borrow at the short-end and lend at the long-end) to continue making loans to maintain growth in the economy. A steepening yield curve would also help to cap the sharp rise in housing prices we’ve seen in the past year, a key goal for those looking to address wealth and asset inequality in the system.

Currencies

FX volatility screens as the cheapest among all asset classes, and we have been using this to hedge some of our high conviction positions in Equities and Rates.

Macro Minute: US Labor Participation

This week, we will once again touch briefly on labor force participation and attempt to make sense of the US Employment Situation Report from Friday.


US labor force participation has been the subject of much discussion lately. Beginning in the 1960s when more women entered the workforce, it has steadily risen, moving from 59.1% to 66.9% by the year 2000. Since then, it has drifted lower and settled near 63% pre-Covid. A drop of almost 4% on the labor participation rate is equivalent to around 10 million jobs. At first glance this seems negative, but we find that most of this was due to strong levels of enrollment in post-secondary education among those aged 16 to 24. This trend began in the late 1980s, and accelerated into the 2000s, hence a deluge of social science majors and a dearth of truck drivers.

Turning to today, let’s analyze some of the most common arguments for explaining the slow recovery of the labor force participation rate.

(1) Self-employment is keeping labor participation low – One way to try to test for that, is to track the difference between the household and the establishment employment data. The household employment figure captures the self-employed, farm workers and domestic help, something the BLS payrolls survey doesn’t do. Here what we find is that household employment suffered more than payrolls during 2020, and still hasn’t recovered to pre-covid levels.

2) Women have been kept out of the labor force because of childcare – There is some indication this may be true. We saw nearly the same number of exits from the labor force for men and women in 2020 (3.9mm & 4.2mm in April ’20, respectively). Those aged 25-34 were the second most affected at the time, accounting for more than 1mm women exiting the labor force. By September 2021, there were still 550k less women aged 25-34 in the labor force than in January 2020, the largest discrepancy across all age brackets. With schools reopening, that number was cut in almost half to 283k in November.

(3) Retirement is keeping people out of the labor force – It is hard to see that clearly in the data. The age group 55 and over (55-64 & 65 and over), suffered the least in both genders and have the least amount of people out of the labor force (when compared to January 2020 levels). Today there is 100k more men 65 and over in the labor force than at the peak in January 2020.

Macro Minute: What to Make of Omicron

The emergence of the Omicron variant undoubtedly increased the risk of a repeat in lockdowns and restrictions the world saw in 2020. Markets started pricing a higher probability of a significant negative impact which we experienced last Friday, November 26th.

We are tracking the developments of the Omicron variant very closely and have begun reducing risk accordingly. Having said that, we believe that there are a few indications that this new variant also increased the upside scenario for the markets, and even more importantly, for global health.


By now, most people are familiar with the downside case the new variant represents. With more than 30 mutations of the spike protein alone (Delta variant had 9), the Omicron variant could be a severe risk to global health. 8 of the Omicron mutations have never been seen before and 9 have been seen in other variants of concern. Lab data suggests that some of the new mutations are a threat and other mutations are still being examined. Some mutations have properties that lower the efficacy of current vaccines, while others show potential for increased transmissibility.

There are  also other indicators that we are currently tracking. The majority of the hospitalized cases are still in unvaccinated people (South African Health Ministry identified that most of the cases seem to be in < 50-year-olds, where the rate of vaccinations are low <20-25%, and also likely that some of these would be immuno-compromised with HIV, etc.). However, it is unclear how many had natural immunity from previous infections.


It is too early to say, but the lack of a surge in hospitalization rates in South Africa combined with early anecdotes of mild symptoms and the knowledge that this variant has had numerous mutations gives rise to the possibility of it becoming a less deadly virus. If this is the case, it could translate into much lower hospitalization and fatality rates. Combine that with higher transmissibility and increased infectivity, and we might just be staring at the light at the end of the tunnel. If this variant is less severe but much more contagious, we could quickly move toward a flu-like endemic illness.


Nevertheless, one of the most interesting pieces of information that came out last week has been given little to no attention. The Omicron variant, unlike other variants, can be tracked via a simple PCR test and will not require genomic sequencing to identify. The reason this is so important requires a practical understanding of how statistics are generated during a pandemic.


The primary source of risk arising from any pandemic is hospitalization and fatality rates, but it is tough to have an accurate number as the infection spreads (and even after it is over). Let’s use fatality rates as an example. The most common approach is to have confirmed deaths associated with the virus (a reasonably reliable indicator in most cases) divided by the number of cases (varies depending on how this is captured). The denominator could be counting only laboratory-confirmed infections, all people who displayed symptoms but were not tested, or the total number including asymptomatic cases. As expected, laboratory-confirmed cases (lowest denominator) yield the highest fatality rates.


The fact that a simple PCR test can detect the Omicron variant does not completely fix the denominator’s problem. However, within laboratory-tested cases, it will make comparison with other variables much faster and efficient. If we find that this new variant has a much lower fatality rate, policies will have to adjust for the new reality, and the risk of a repeat in lockdowns and an even bigger health crisis dissipates. We will learn more in the next couple of weeks.