This week, we will once again touch briefly on labor force participation and attempt to make sense of the US Employment Situation Report from Friday.
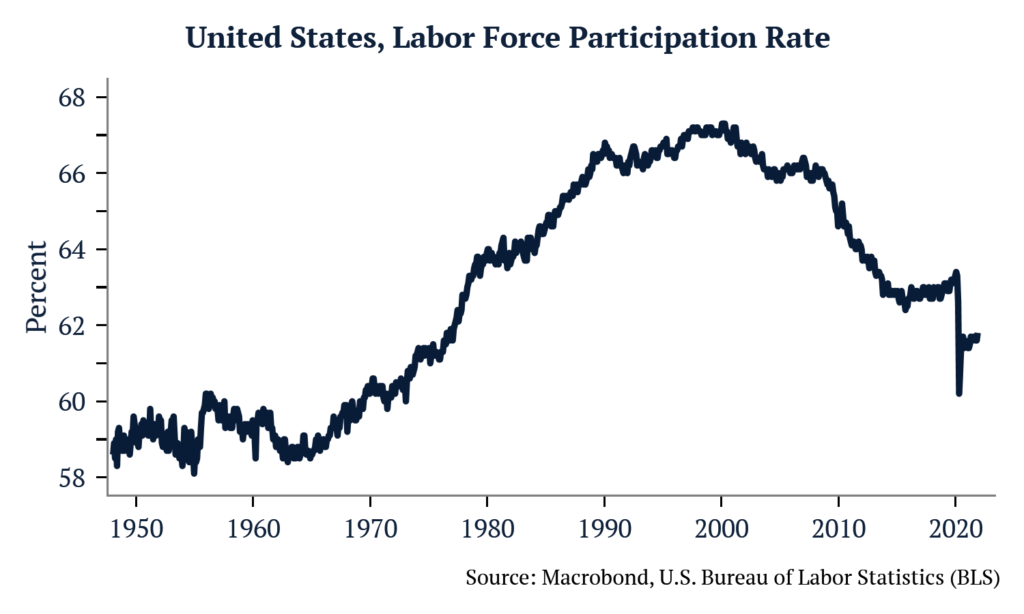
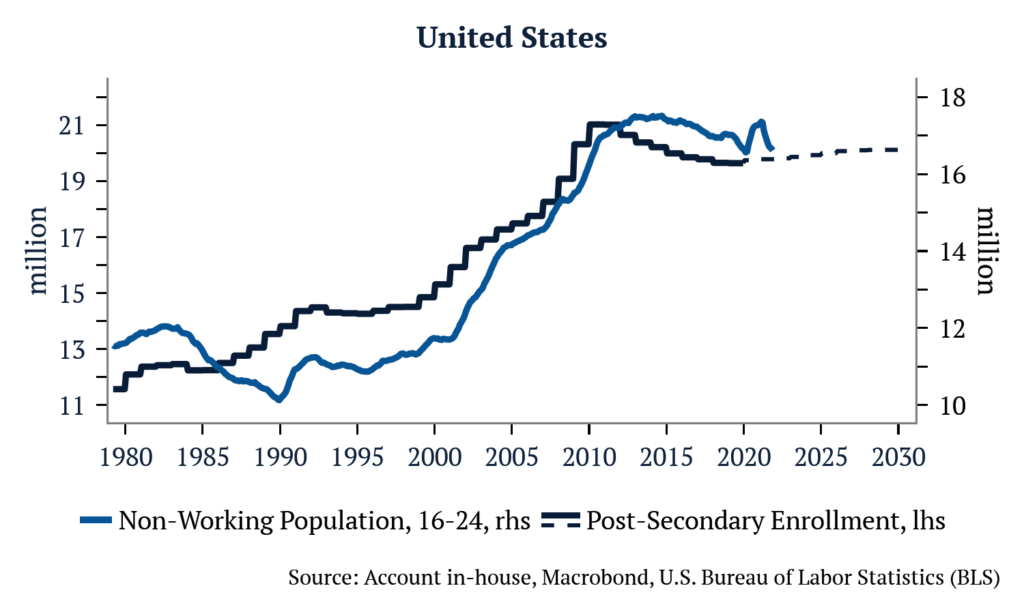
US labor force participation has been the subject of much discussion lately. Beginning in the 1960s when more women entered the workforce, it has steadily risen, moving from 59.1% to 66.9% by the year 2000. Since then, it has drifted lower and settled near 63% pre-Covid. A drop of almost 4% on the labor participation rate is equivalent to around 10 million jobs. At first glance this seems negative, but we find that most of this was due to strong levels of enrollment in post-secondary education among those aged 16 to 24. This trend began in the late 1980s, and accelerated into the 2000s, hence a deluge of social science majors and a dearth of truck drivers.
Turning to today, let’s analyze some of the most common arguments for explaining the slow recovery of the labor force participation rate.
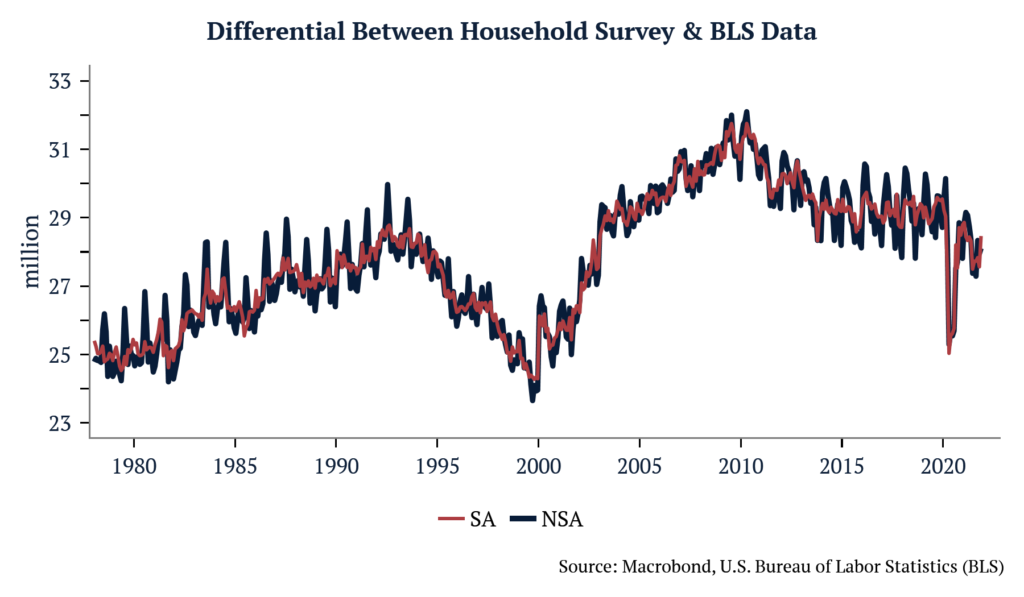
(1) Self-employment is keeping labor participation low – One way to try to test for that, is to track the difference between the household and the establishment employment data. The household employment figure captures the self-employed, farm workers and domestic help, something the BLS payrolls survey doesn’t do. Here what we find is that household employment suffered more than payrolls during 2020, and still hasn’t recovered to pre-covid levels.
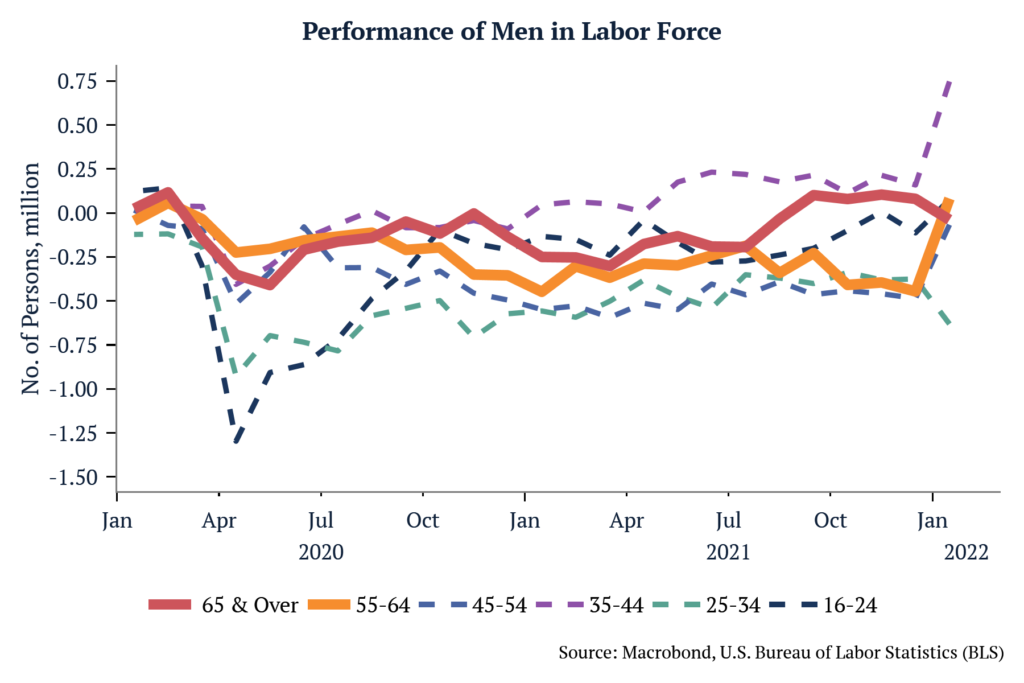
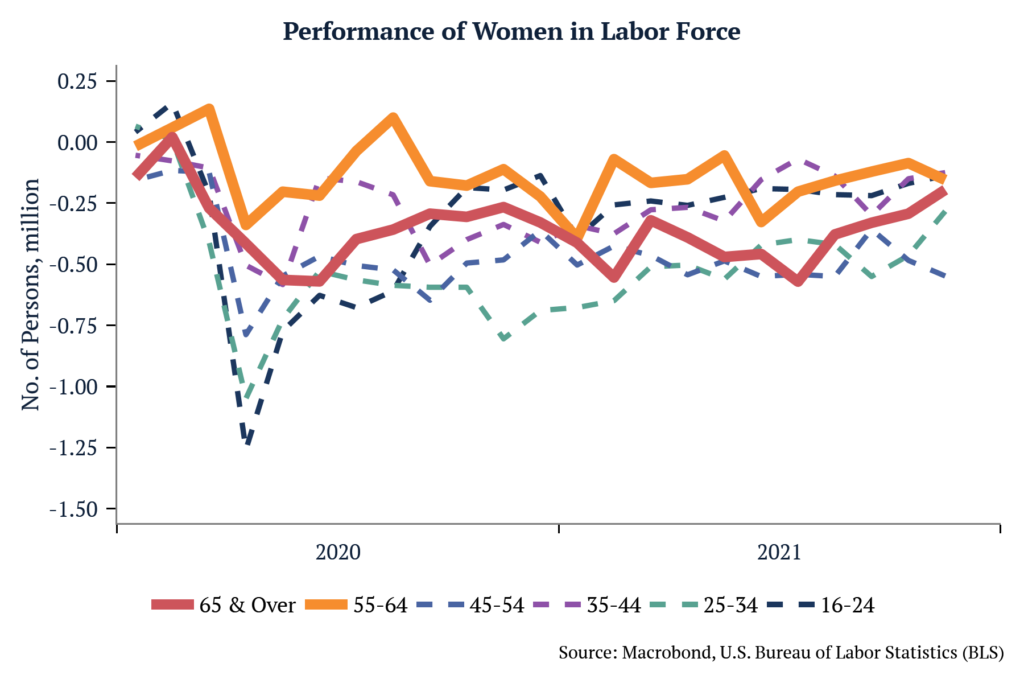
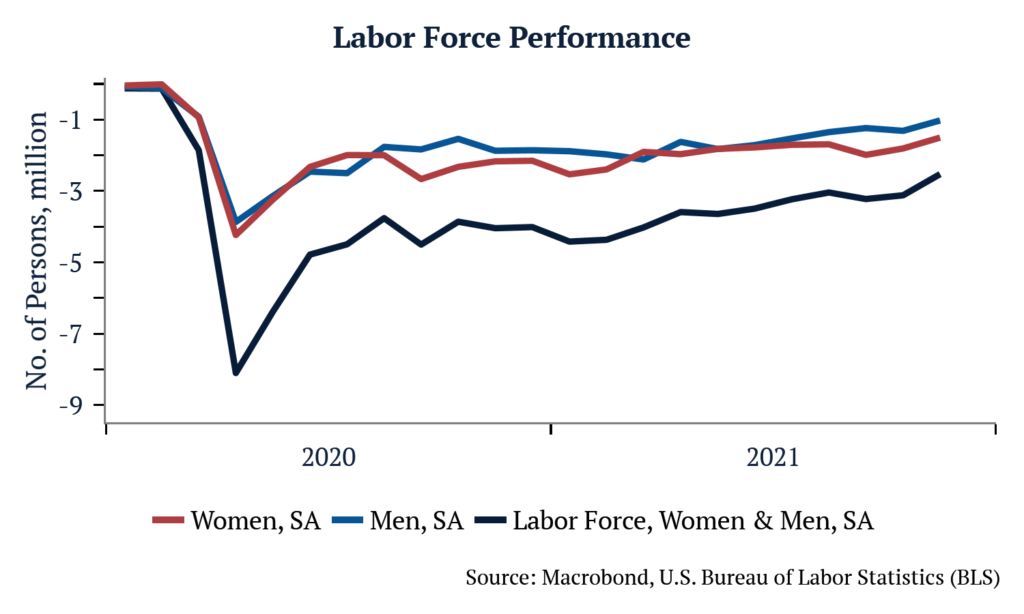
2) Women have been kept out of the labor force because of childcare – There is some indication this may be true. We saw nearly the same number of exits from the labor force for men and women in 2020 (3.9mm & 4.2mm in April ’20, respectively). Those aged 25-34 were the second most affected at the time, accounting for more than 1mm women exiting the labor force. By September 2021, there were still 550k less women aged 25-34 in the labor force than in January 2020, the largest discrepancy across all age brackets. With schools reopening, that number was cut in almost half to 283k in November.
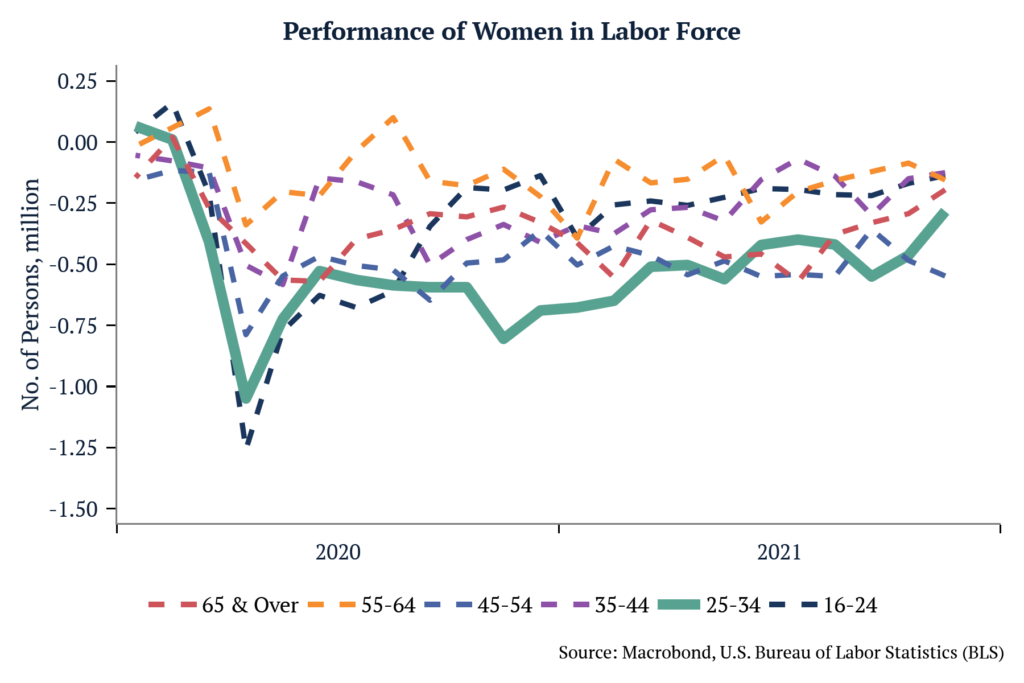
(3) Retirement is keeping people out of the labor force – It is hard to see that clearly in the data. The age group 55 and over (55-64 & 65 and over), suffered the least in both genders and have the least amount of people out of the labor force (when compared to January 2020 levels). Today there is 100k more men 65 and over in the labor force than at the peak in January 2020.