Macro Minute: Commodity Inventories

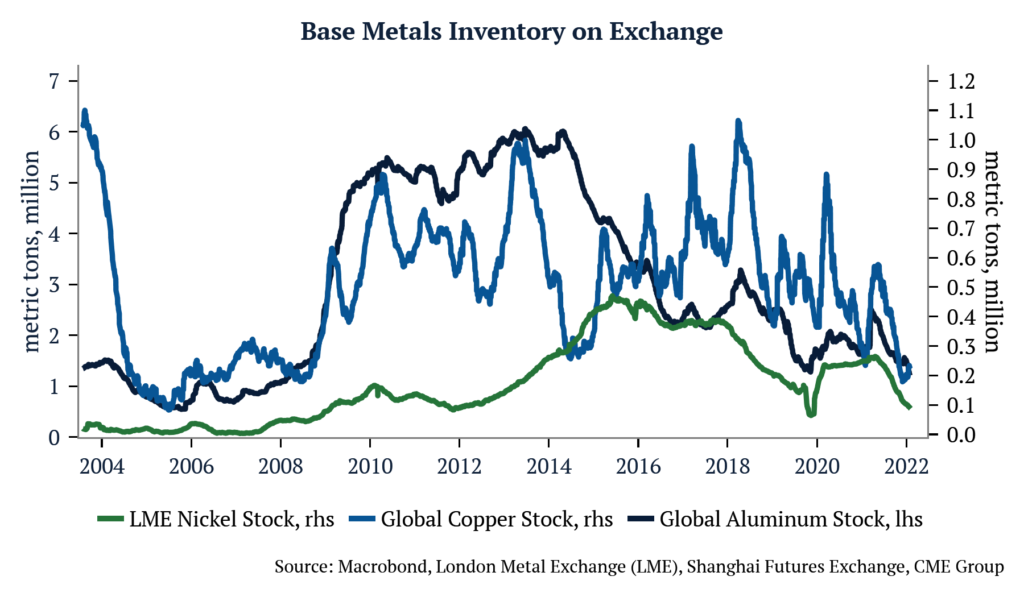
A quick note on commodities… Historically tight inventories have led to all six base metals (Aluminum, Copper, Nickel, Lead, Tin, Zinc) listed on the London Metals Exchange to trade in backwardation for the first time since 2007.

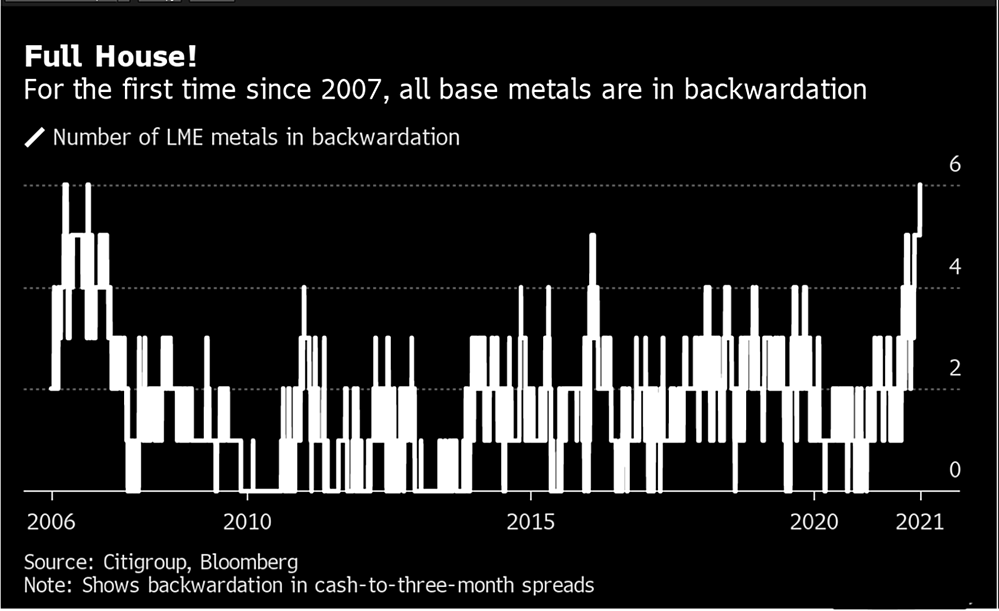
Of those six, some of the tightest markets are in Aluminum, Copper and, especially, Nickel, which has the largest deficit in its history. Using the average daily production of each metal and aggregate inventories across Shanghai, London, and United States metal exchanges, we estimate global aluminum inventories to be approximately 5.8 days of production, copper at 2.2 days of production, and nickel at just under 13 days of production. Actual daily draws from exchange are variable, but this illustration speaks to the level of tightness in the market.

All but tin have upside to the levels reached in the last period of backwardation across the sector, after adjusting metal prices for inflation.

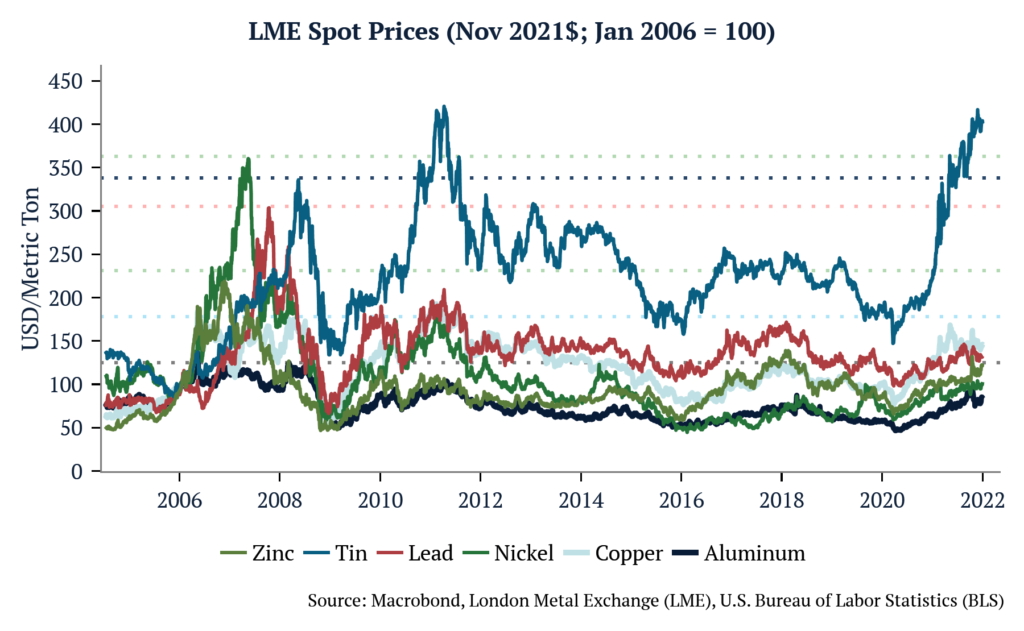
Bear in mind that while the price run-up in 2007 was also the result of a supply shock, albeit for different reasons, there was a sharp decline in demand caused by the bursting of the housing bubble and onset of the Great Financial Crisis, just as more supply began to come to market. The setup this time appears to be different. Persistent underinvestment in commodity extraction over the past decade, coupled with increased demand driven by government net-zero goals rather than private industry (e.g., homebuilders), suggest that this rally could be much tighter for much longer. With EV penetration increasing around the world, including in China, where nearly 20% of new car sales are electric, and the fact that those vehicles require between 5-6x more metal than internal combustion engines, we could see pressures drive prices past 2007 levels.

Macro Minute: Fiscal Cliff vs. Excess Savings

Looking ahead to 2022, much has been written about the pending fiscal cliff and its impact on Real GDP Growth. As the impact of fiscal stimulus dissipates and the federal government mulls tax increases, analysts expect fiscal impulse to shift from positive to negative next year.

Figure 1: Effect of Fiscal Policy on Real GDP Growth (3Q CMA) [Source: Goldman Sachs]

In our estimation, given the levels of excess personal savings reached in the past 20 months, we believe there is enough pent-up savings to compensate for the forthcoming negative fiscal impact on GDP. Using seasonally adjusted personal income minus personal consumption expenditures as a proxy for personal savings, we find that from April 2020 through September 2021, Americans generated over $2.8 trillion in excess savings, amounting to approximately 12% of GDP. That compares with approximately 4% of fiscal drag projected for 2022.

Macro Minute: What’s going on in the US Labor Market?

With job openings, participation rate, and unemployment central to the current discourse on markets, the topic of this month’s memo is the United States labor force.  

Focusing on the four largest sectors (which add up to more than 60% of payrolls and job openings in the US economy), we can see that wage inflation is a pattern that predates the onset of covid. In other words, wage inflation is not simply a result of covid supply shocks, it is based on fundamentals in the economy, and therefore it is not transitory. 

1 – Trade, Transportation & Utilities (19% of total Payrolls, 18% of total Job Openings)  In 2018, demand for work (job openings) started to grow much faster than supply (using payrolls as a proxy). As a result, average hourly earnings growth for this sector has surged from an average of 2.25% percent in 2018 to over 4% today (and 3.35% pre-covid). 

2 – Education & Health Services (16% of total Payrolls, 18% of total Job Openings) Hereto the story is very similar, but it started even earlier. In 2014, demand for work accelerated faster than supply of workers, driving an increase in earnings from 1.5% to 3.4% today (and 2.5% pre-covid).

3 – Professional & Business Services (14% of total Payrolls, 18% of total Job Openings) In Professional & Business Services, we saw two waves. The first in 2014 and the second in 2018, causing an increase in earnings from 1.5% to 2.3% in the first wave, and from 2.3% to 4% today (and 3.3% pre-covid).

4 – Leisure & Hospitality (10% of total Payrolls, 14% of total Job Openings) Leisure & Hospitality is the only sector in the top 4 that has gone through two opposite cycles since 2014. The first was with the demand for work growing faster than supply starting in 2014, increasing earnings growth from 1% to 4% in 2017. The second cycle took place starting in 2018, with labor supply growing faster than demand, and earnings growth falling to 3.5%. Today we are back at 4% growth, last seen entering 2018. It is worth noting that today, the demand for work in this sector is at historical highs while supply is back near the levels of 2010.

Labor Supply Shock

The last point has to do with the temporary labor supply shock that happened due to covid. Comparing jobless claims numbers between states that ended extra unemployment benefits before the September 6th deadline and those that adhered to the target, we see that the states that finished earlier have a much more accelerated and consistent contraction in claims across latter weeks. With this in mind, we expect some of this labor supply shock to normalize as we get farther from the deadline. However, when we look at the pre-covid trend, we believe that this will not be enough to avoid wage inflation.