
On the artist’s color wheel, red and green are considered complementary colors, diametrically opposed from one another but known to harmonize when used together. However, for at least a decade, the biggest political proponent of green energy in America has been the “blue” Democratic Party.
The administration’s most recent spending bill, The Inflation Reduction Act of 2022, has been heralded as a huge leap forward for renewable energy in the United States by Democrats, but was opposed by every Republican in the House and Senate. A closer look at where renewable infrastructure is being built, thereby creating jobs and increasing investment, demonstrates that while on Capitol Hill, the reds may be diametrically opposed to green legislation, red and green may actually be quite complementary. We believe that green investment will have meaningful repercussions come election season for years to come.
In our 2021 Annual Report, we discussed how our most probable scenario for achieving net-zero by 2050 would require expansive transmission and generation infrastructure to be built in the American heartland, primarily in traditionally Republican states. In turn we suggested that the development of said infrastructure would result in significant job creation and local investment, that would lead to one of two outcomes – more bipartisan support for investment in green infrastructure as Republicans acted in the interests of their constituents or a change in voting patterns by those being positively impacted by investment and new jobs.
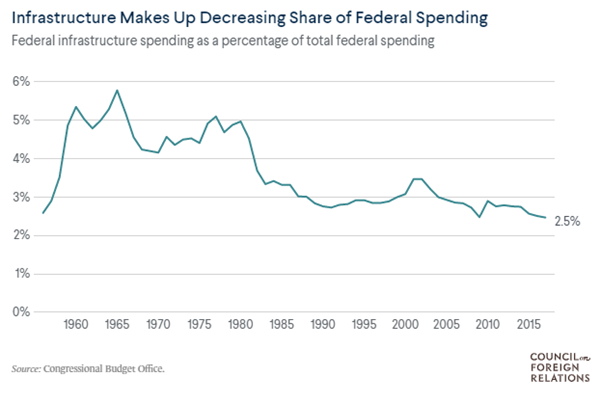
A 2014 study by the University of Maryland found that a $1 spent on infrastructure investment added as much as $3 to US GDP[1] and suggested that the effect could be even larger in a recession. Historically, state and local governments have borne the majority of costs for spending on infrastructure – since 1956, they have been responsible for approximately 75 percent of spending on infrastructure. In that time frame, federal infrastructure spending has increasingly become a smaller percentage of the overall budget.
When the federal government does spend, it is typically through capital investment for new projects or modernization. The nonprofit, nonpartisan Tax Foundation estimates $116 billion of new energy and climate spending, excluding tax credits, from the newly passed legislation.[1] Including leverage available through components of the bill like the Energy Infrastructure Reinvestment Financing program, which provides $5 billion to finance up to $250 billion in projects for energy infrastructure, including repurposing or replacing energy infrastructure, takes new spending to more than $300 billion over 10 years. The last Congressional Budget Office estimate for federal government infrastructure spending was approximately $98 billion per year, meaning the bill would increase spending by around 30% annually, excluding tax credits that will encourage more private investment. Why is this important? Using percent changes in GDP, inflation, and the S&P 500 as barometers for economic conditions, Lewis-Beck and Martini[2] demonstrated the existence of a map from real economic conditions, to voter perceptions, to vote choice. Put simply, voters’ evaluation of the economy is real, and they punish or reward the incumbent candidate based on these conditions.
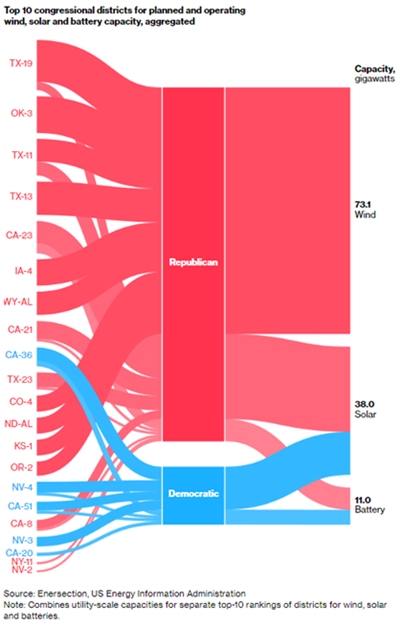
Bloomberg recently ran an article titled ‘Red America Should Love Green Energy Spending’, showing where a bulk of renewable infrastructure is being built. There are 435 congressional districts in America. 357 have planned or operating solar plants, with 70% of the power capacity found in republican districts. 134 have planned or operating wind plants, with 87% of the capacity found in red districts. Lastly, 192 have planned or operating battery storage facilities, with 58% of the capacity in right-leaning districts. Of the top-10 districts with planned or operating renewable infrastructure, nine are currently Republican-held seats, and within that group, 86% of total capacity is found in Republican districts.
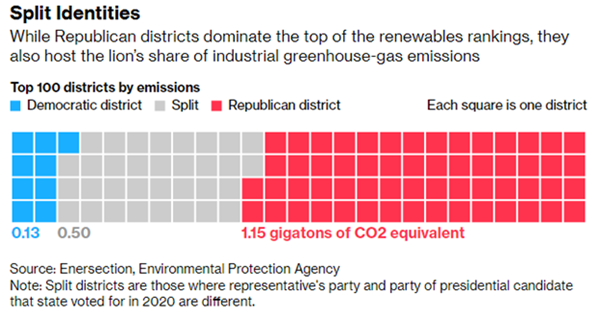
So why might Republicans who are overwhelmingly benefiting from job creation and investment in green infrastructure be against such legislation? First, some of the capacity listed is planned, and has yet to filter through into the local economies they represent. Second, there are elements of both NIMBY-ism and extreme partisanship throughout the country on both sides that lead people to immediately dismiss ideas from “opposing” parties. But most obvious to us is that Republicans also overwhelmingly represent areas with the most emissions. 80% of the top-100 emitting districts are represented in Congress by Republicans, including eight of the top-10.
n the 2020 election cycle, fossil fuel companies spent $63.6 million lobbying Republicans compared to $12.3 million for Democrats, and since 1990 the industry has spent approximately 4.3 times the amount lobbying for Republicans than Democrats. In other words, support for green investment will ultimately come at a cost for the party. However, a myriad of studies have demonstrated that infrastructure investment boosts productivity over time and the literature shows that this will ultimately have an impact on voter preferences. Voter preferences fundamentally drive political rhetoric, so as green infrastructure investment becomes more pervasive, particularly in red states, we expect an increasing impact of renewable energy development on elections.
[1] Werling and Horst. “Catching Up: Greater Focus Needed to Achieve a More Competitive Infrastructure.”
[2] https://taxfoundation.org/inflation-reduction-act/
[3] Lewis-Beck C, Martini NF. Economic perceptions and voting behavior in US presidential elections. Research & Politics. October 2020. doi:10.1177/2053168020972811