On the artist’s color wheel, red and green are considered complementary colors, diametrically opposed from one another but known to harmonize when used together. However, for at least a decade, the biggest political proponent of green energy in America has been the “blue” Democratic Party.
The administration’s most recent spending bill, The Inflation Reduction Act of 2022, has been heralded as a huge leap forward for renewable energy in the United States by Democrats, but was opposed by every Republican in the House and Senate. A closer look at where renewable infrastructure is being built, thereby creating jobs and increasing investment, demonstrates that while on Capitol Hill, the reds may be diametrically opposed to green legislation, red and green may actually be quite complementary. We believe that green investment will have meaningful repercussions come election season for years to come.
In our 2021 Annual Report, we discussed how our most probable scenario for achieving net-zero by 2050 would require expansive transmission and generation infrastructure to be built in the American heartland, primarily in traditionally Republican states. In turn we suggested that the development of said infrastructure would result in significant job creation and local investment, that would lead to one of two outcomes – more bipartisan support for investment in green infrastructure as Republicans acted in the interests of their constituents or a change in voting patterns by those being positively impacted by investment and new jobs.
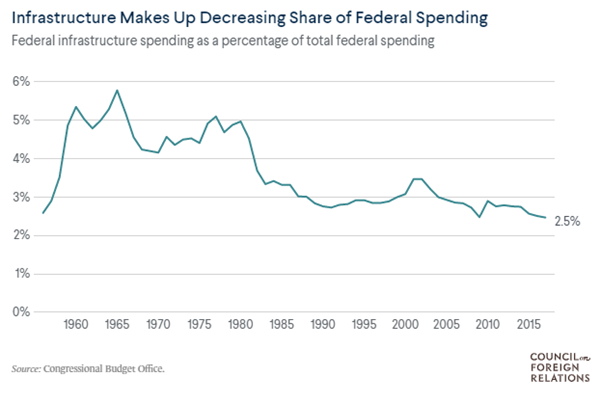
A 2014 study by the University of Maryland found that a $1 spent on infrastructure investment added as much as $3 to US GDP[1] and suggested that the effect could be even larger in a recession. Historically, state and local governments have borne the majority of costs for spending on infrastructure – since 1956, they have been responsible for approximately 75 percent of spending on infrastructure. In that time frame, federal infrastructure spending has increasingly become a smaller percentage of the overall budget.
When the federal government does spend, it is typically through capital investment for new projects or modernization. The nonprofit, nonpartisan Tax Foundation estimates $116 billion of new energy and climate spending, excluding tax credits, from the newly passed legislation.[1] Including leverage available through components of the bill like the Energy Infrastructure Reinvestment Financing program, which provides $5 billion to finance up to $250 billion in projects for energy infrastructure, including repurposing or replacing energy infrastructure, takes new spending to more than $300 billion over 10 years. The last Congressional Budget Office estimate for federal government infrastructure spending was approximately $98 billion per year, meaning the bill would increase spending by around 30% annually, excluding tax credits that will encourage more private investment. Why is this important? Using percent changes in GDP, inflation, and the S&P 500 as barometers for economic conditions, Lewis-Beck and Martini[2] demonstrated the existence of a map from real economic conditions, to voter perceptions, to vote choice. Put simply, voters’ evaluation of the economy is real, and they punish or reward the incumbent candidate based on these conditions.
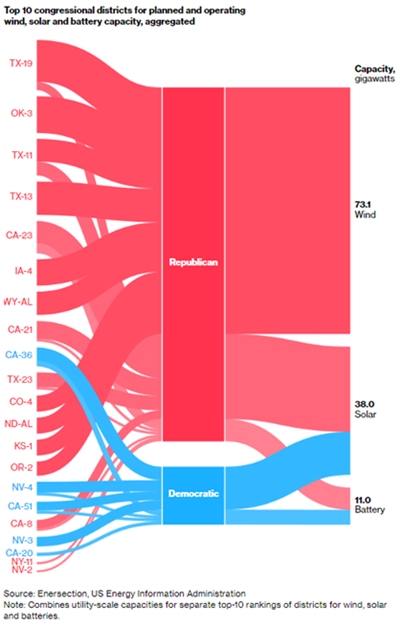
Bloomberg recently ran an article titled ‘Red America Should Love Green Energy Spending’, showing where a bulk of renewable infrastructure is being built. There are 435 congressional districts in America. 357 have planned or operating solar plants, with 70% of the power capacity found in republican districts. 134 have planned or operating wind plants, with 87% of the capacity found in red districts. Lastly, 192 have planned or operating battery storage facilities, with 58% of the capacity in right-leaning districts. Of the top-10 districts with planned or operating renewable infrastructure, nine are currently Republican-held seats, and within that group, 86% of total capacity is found in Republican districts.
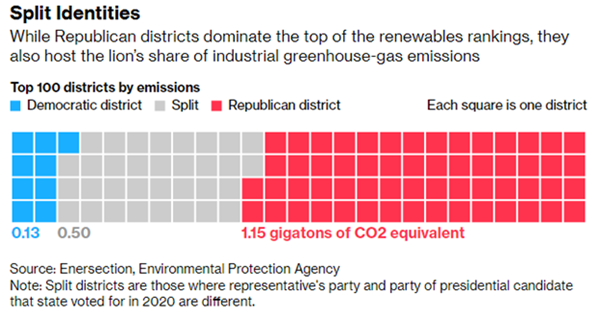
So why might Republicans who are overwhelmingly benefiting from job creation and investment in green infrastructure be against such legislation? First, some of the capacity listed is planned, and has yet to filter through into the local economies they represent. Second, there are elements of both NIMBY-ism and extreme partisanship throughout the country on both sides that lead people to immediately dismiss ideas from “opposing” parties. But most obvious to us is that Republicans also overwhelmingly represent areas with the most emissions. 80% of the top-100 emitting districts are represented in Congress by Republicans, including eight of the top-10.
n the 2020 election cycle, fossil fuel companies spent $63.6 million lobbying Republicans compared to $12.3 million for Democrats, and since 1990 the industry has spent approximately 4.3 times the amount lobbying for Republicans than Democrats. In other words, support for green investment will ultimately come at a cost for the party. However, a myriad of studies have demonstrated that infrastructure investment boosts productivity over time and the literature shows that this will ultimately have an impact on voter preferences. Voter preferences fundamentally drive political rhetoric, so as green infrastructure investment becomes more pervasive, particularly in red states, we expect an increasing impact of renewable energy development on elections.
[1] Werling and Horst. “Catching Up: Greater Focus Needed to Achieve a More Competitive Infrastructure.”
[3] Lewis-Beck C, Martini NF. Economic perceptions and voting behavior in US presidential elections. Research & Politics. October 2020. doi:10.1177/2053168020972811
In a fitting end to an already tumultuous year, the 2020 election cycle has (nearly) ended with President-elect Joe Biden announcing members of his cabinet and further refining his platform. One key tenet of his preelection policy agenda was an infrastructure bill with a focus on the renewable sector, but the prospect of a divided government will meaningfully change the size and scope of any legislation passed.
As it stands, there will be 50 Republican senators and 48 Democratic senators, with two seats remaining to be decided in the Georgia runoffs this January. The best historical precedents for these races are the 1992 and 2008 Georgia Senate runoffs, both in presidential election years, which saw a decline in turnout from the general election and the Democrats losing more support than Republicans.
Given the aggregate Republican lead in both races on Election Day, it will be a steep hill for the Democratic Party to climb. Even in a narrowly controlled Democratic Congress, we predict it will be difficult to set pollution limits on greenhouse gases given the producer and consumer states from which certain senators hail. In the face of a divided government, Biden will have to pull on different levers to pursue an infrastructure and clean energy agenda. Following the last two presidents, I expect a healthy amount of regulatory and executive action to be used for achieving policy goals.
A narrow margin in Congress means a less aggressive Clean Energy Standard than Biden campaigned on and may require the inclusion of somewhat forgotten energy industries like nuclear and hydropower. A technology-agnostic clean-energy standard for utilities and the grid would likely include the continued use of natural gas power plants with carbon-capture technology because renewable energy remains intermittent.
From where we stand, improved battery technology can take two paths: First, batteries at the grid level could decrease natural gas dependence by solving the intermittence issues of renewable energy, and second, batteries at the electric vehicle (EV) and home level could increase the dependance on natural gas for the grid as residential consumers consume more electricity. This is all to say that prospects for traditional energy sources are not as bleak as one might think and that the accelerating adoption of EVs might accelerate demand for natural gas in the short to medium term and impact commodity prices.
The government also has massive buying power. We expect the Department of the Interior to be far more active in its pursuit and purchasing of alternative energy sources. Offshore wind and solar are proven technologies with decreasing costs that can be looked to by the administration to “green-ify” the grid without the need for massive fiscal stimulus simply by using the existing government balance sheet.
Some analysts believe that even with a Republican-led Senate, the multibillion-dollar planned spending on the electric grid from President-elect Biden’s “Build Back Better” plan could pass as part of a broader bipartisan stimulus bill focused on jobs and infrastructure next year. Said grid spending could encompass and support energy efficiency and weatherization technology. Grid innovation, in large part, is a necessary complement to the aggressive adoption of EVs while energy efficiency and weatherization legislation will impact builders, owners and retrofitters of both commercial and residential real estate.
In our experience, investors cleanly (forgive the pun) put environmentally innovative energy investments into two buckets: new technologies and process innovation. I believe that the forthcoming Biden innovation will use a mix of executive action and legislation to participate in both buckets, with a divided government forcing a greater emphasis on legacy process innovation than a democratic sweep would have otherwise pursued.
Three of the largest segments we expect the government to invest in are electric vehicles, electric vehicle infrastructure and hydrogen power. Having already discussed the first two, we will focus on hydrogen power: a possible substitute from electric generation in natural gas power plants. New York, Virginia and Ohio recently paid more than $3 billion for three power plants that will initially run on natural gas but be outfitted for using green hydrogen, produced by wind and solar, as collection ramps up. We expect hydrogen storage to be an ever-increasing pillar of the energy complex and look to companies in the space to offer value in the coming decade.
In conclusion, a divided government sets the stage for a smaller, albeit interesting, infrastructure and clean energy agenda that will impact both new inventions and legacy energy tech. We’re interested to watch how the incoming administration navigates all-too-familiar D.C. gridlock, a global pandemic and a recovering economy. A few other industries worth watching are renewable diesel and natural gas, energy efficiency as a service, and energy efficiency in oil fields and digital infrastructure.
If you haven’t had the opportunity to read Part 1 from this series of Special Reports on the United States election, you can find it here. As a refresher, we used a combination of historical and mathematical analysis to arrive at probabilities for a Biden-Harris win and a Blue Wave, defined as a Democrat-controlled House, Senate, and Oval Office. Below, we will begin with a quick update of our election forecasts before moving onto the prospective impact of said forecasts on fiscal policy. We will then more closely examine the high-level and near-term spending implications of former Vice President Biden’s policy agenda on industries and sectors before wrapping up with a look at how a bipartisan push for antitrust legislation might manifest.
Refreshing Probabilities: Senate Seats Matter With two weeks left until Election Day, our current forecasts estimate a 91% chance of Mr. Biden winning the presidency and a 69.3% probability of a Blue Wave. Our Blue Wave probability includes all permutations of contested Senate races that would result in a 50-50 split or better for Democrats (given the Vice President holds the tiebreaking vote in the Senate). The probability of Democrats having at least 50 seats is 76%, which drops to 44% for 51 seats, 15% for 52, and quickly converges toward zero as we add more Democrats to the Senate. This is an important distinction to make before discussing fiscal policy because a 50- or 51-person majority will require a legislative agenda that satisfies moderate centrists for Democrats to carry the necessary votes. For this reason, we continue to closely monitor Senate races in states like Iowa and North Carolina that will ultimately decide the balance of power in the Senate, and thereby guide our views on impending fiscal policy and subsequently, our market outlook.
Under current rules, Congress can make changes to taxes and benefits programs with a simple 51-vote majority in the Senate through use of the budget reconciliation process. However, annual spending bills (appropriations) and the establishment of new programs require a filibuster-proof 60 votes to pass the Senate, as do changes to regulatory policy, antitrust law, immigration, and minimum wage. Elimination of the filibuster has been floated by both parties since the turn of the century and will be under consideration in the case of a marginal Blue Wave in order to expedite the passage of Democratic legislation, but is unlikely to be the first bill passed.
Although it would require bipartisan support to reach 60 votes, we view the passage of an infrastructure bill in the second half of next year after another virus relief package as the most probable leg of Blue Wave fiscal policy. Subsequently, we view a broad reconciliation bill covering changes to healthcare and tax increases as likely to follow, needing only 51 votes, but with a lower probability considering the support needed from moderate Democrats in a 50- or 51-Democrat Senate. The last and least probable pillar of Mr. Biden’s legislative agenda is education, which would need to pass with 60 votes and extends from pre-K to university, drawing on former candidate Senator Bernie Sanders’ bill for higher education.
Fiscal Policy for a Blue Wave Notwithstanding a Covid-19 stimulus package, the Biden-Harris ticket has set forth an aggressive fiscal agenda with estimate gross spending between $9-10 trillion over the next ten years. They intend to offset approximately $5 trillion of this spending through tax increases, budget reappropriations and savings. Our analysis here is focused on gross additional spending over the next decade, how it compares to spending this past decade, and how much of the spending we estimate to occur during Mr. Biden’s first term.
We’ll begin with an examination of spending on infrastructure, research, and development. It is interesting to note that private investment in fixed assets (specifically residential and non-residential buildings, industrial equipment, and transportation equipment) was just over six times that of government investment in infrastructure (mostly transportation) from 2010 to 2019 – in other words, every $1 committed to government infrastructure investment resulted in $6 of investment from the private sector. At this point, it remains unclear if Democrats’ infrastructure and R&D policies will crowd out the private sector, or if they will be additive and result in private sector expansion. Former Vice President Biden’s Build Back Better infrastructure plan contains $2 trillion in funds earmarked mainly for transportation and clean energy infrastructure, but also includes $300 billion for research & development, $300 billion for housing construction, and $100 billion for education-related construction. In aggregate, the Congressional Budget Office estimates the net increase in infrastructure spending will amount closer to $450 billion over 10 years, but expect a Democratic Congress to at the very least pass legislation that boosts infrastructure spending by a few hundred billion over the next 5 years, including tax incentives for renewable energy.
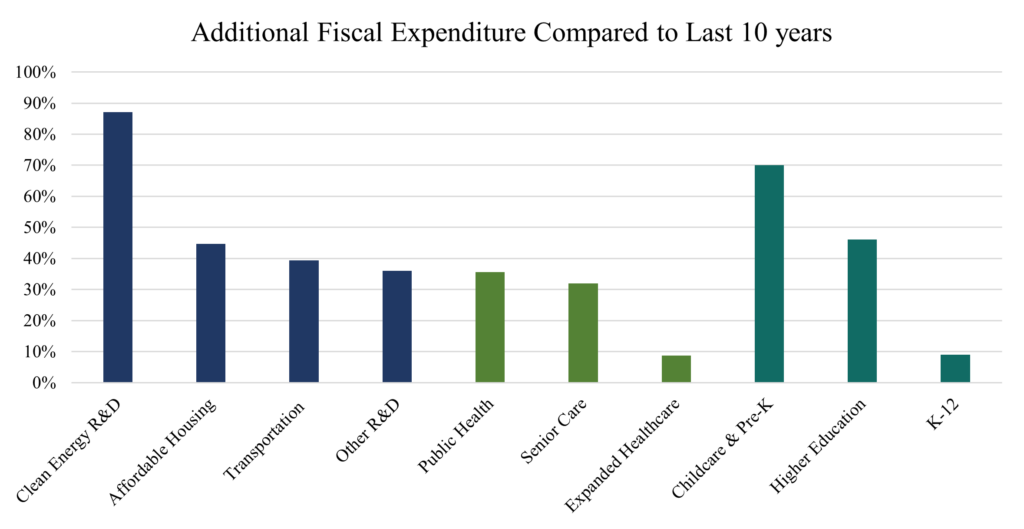
Government investment in non-defense energy, natural resources, environment, and general science research and development totaled $172.6 billion from 2010 to 2020 – this plan pledges an additional $150 billion, or an 87% increase over the next decade, to clean energy research and development. Mr. Biden’ plan also commits $750 billion to affordable housing through expansion of Section 8 and a tax-credit for first-time homebuyers. Last year’s data shows that 33% of homes were purchased by first-time buyers and 4% of United States households are on some type of federal housing assistance. Using this as an approximate basis for private sector spending in these areas, this amounts to a 44.7% increase in spending on first-time homeownership and affordable housing over last decade. Assuming half of the $2 trillion is invested in transportation projects over the next ten years, Mr. Biden’s plan will have committed an additional 39.4% of total investment by state, local, and federal governments this decade. Finally, he has pledged another $150 billion to healthcare, infrastructure, and telecom research and development, which amounts to about 36% of healthcare and transportation R&D in the past decade. Research spending is the most frontloaded of his agenda, with approximately 30% expected to occur within his first term.
Moving on to healthcare, where total spending in the next decade is expected to be approximately $2.8 trillion, not including expanded social security or supplemental security income. Mr. Biden’s healthcare plan includes $300 billion for rural health, mental health, and to aid the opioid crisis. In practice, this means doubling federal funding for Community Health Centers, increasing payments to rural facilities, and expanded funding for mental health services. When compared to aggregate spend on public health activity since 2010, this sums to a 35.5% increase for the next decade. Support for the elderly and those in need of long-term care is expected to increase by $600 billion, an estimated 32% of total public and private spending on senior and elderly living care from 2010 to 2020. The final leg of his plan intends to build on former President Obama’s Affordable Care Act by expanding subsidies and enrolling low-income families in premium-free coverage. The estimate cost of expanded health insurance coverage for Americans is $1.9 trillion, which is only 8.7% of the staggering $21.9 trillion that has been spent on private health insurance, Medicare, and Medicaid in America since 2010. Altogether only about 21% of this spending is expected to occur during the Biden-Harris first term.
Ending with education, where our estimates show aggregate spending in excess of $2.5 trillion over the next decade. Mr. Biden’s plan includes access to free pre-K for all children aged 3-4 through a mixed delivery system combining public schools and private care centers. Additionally, he plans to make the existing tax credit for child and dependent care fully refundable and expand it to cover half of all expenses for one or more children, capped at $8,000 and $16,000 respectively. Biden’s agenda for the Childcare Support & pre-K program is $325 billion over the next decade – which would add 70% to aggregate investment in childcare and pre-K as compared to the previous decade. The largest of the educational spending programs is for higher education, where estimated spending, including free tuition to public universities and colleges for families below $125,000 in income, is $1.6 trillion. This amount of stimulus is equal to 46% of total expenditures by public higher education institutions since 2010 and will grow given the desire to legislate future forgiveness of student loans. In other words, a Blue Wave would result in the federal government covering nearly half of all tuition paid at public higher education institutions in the past decade! Conversely, the additional funding apportioned to support K-12 education in inner cities and for disabled students is a big headline number, $600 billion, but would only represent an increase of about 9% of total public school spending compared to the last 10 years. In total, about 28% of this spending is expected to occur in Mr. Biden’s first term using a 2022 start-date for the education stimulus due to legislative timing.
Former Vice President Biden has laid out an extensive fiscal policy agenda that will be most affected by the Senate results November. We have looked closely at his policies and identified a few key sectors to follow as we begin to position for a Blue Wave: clean energy, homebuilders, industrials, and healthcare.
Implications of Bipartisanship on Anti-Trust In addition to aggressive fiscal policy, a Democratic White House and Congress might seek substantial changes to antitrust law and, in the process, re-order the mergers and acquisition market for a very long time.
Even with markets slowed by Covid-19, North American M&A activity reached $226.8 billion over 2,205 transactions in Q2 2020 alone. The United States has developed a robust and well understood body of antitrust law to regulate the M&A market and prevent, or at least impede, anticompetitive market concentration of power and the rise of monopolies. This issue has gotten very real attention from the House of Representatives in connection with their investigation concerning whether giant US tech companies have acquired and exercised anticompetitive power in digital and online marketplaces. On October 6, the House Judiciary Committee concluded a 16-month investigation asserting that these large tech companies have very much done so and that there is a “clear and compelling need to strengthen antitrust enforcement.”
The report carries with it the potential, if the recommendations are adopted, to restructure the M&A marketplace as it flips presumptions that have been in place in antitrust law since Standard Oil was broken up as a monopoly in 1911 after the U.S. Government sued it for violations of the Sherman Act. The presumption, under the report, is that companies wishing to merge will have to prove that their mergers or acquisitions are not anticompetitive instead of it being the responsibility of the Government to prove that the mergers or acquisitions are anticompetitive; this is a significant shift. A consequence from this is that we may see many more creative and innovative forms intended to defeat or impede government review – for example, joint ventures where there is no formal combination but in which form the result could still be the same – concentration of market power but now without formal antitrust review.
The Committee also proposes to block all acquisitions of potential rivals and nascent competitors. It suggests that such activity be considered presumptively anticompetitive and thus prohibited. This might have the unanticipated consequence of, in the tech space, deterring startups and innovation as founders lose a natural exit. In the pharmaceutical space, where much of the R&D for truly innovative products is outsourced to startups who are then later acquired, this could have the effect of depriving the world of significant medical treatment research and advancement as drug companies can no longer buy potential competitive bio-tech research firms with interesting advances.
All things considered, the report is a clarion call to Congress to take a leadership role in antitrust policy formulation and enforcement. This would represent a major change in the entire market as professionals who have previously guided antitrust policy and enforcement are replaced by those who are instead governed by a two-year fundraising and election cycle. This is coupled with a significant call to re-invigorate private antitrust enforcement by undoing or eliminating significant amounts of precedent and jurisprudence related to antitrust actions, including lowering the standards by which a court should even evaluate a pleading. This will, if taken up, result in a massive amount of private litigation risk that every merger or acquisition will now have to expect and plan for. It remains to be seen whether the current M&A insurance market or the policies that insurance companies have written for directors and officers will cover the private litigation risks that might be a natural consequence of some of the changes presented in the face of a Blue Wave.
Currently, antitrust law has bipartisan support, and as laid out by the House committee, presents meaningful future risks to the technology sector and could result in systemic market disruption after the election. We are closely following both parties’ rhetoric and the evolution of the House Committee and Supreme Court’s views into and past Election Day as we measure current and future US market risk.
As always, we will continue to monitor markets, polls, and macro data to update our views. We appreciate you taking the time to read part 2 of our series on US Elections. If you have any questions, please don’t hesitate to get in touch with one of us.
This is the first piece in a series of Special Reports we will be writing on the 2020 US Elections. The first part of this report is a primer on US election cycles – if you are familiar with how the bicameral Congress and President are elected in the United States, please feel free to skip ahead to the second section of this report where we get into our detailed forecasts for this election cycle.
Background on US Elections
Every four years, the United States convulses in an extraordinary spectacle – a mixture of high policy disagreement (economic, foreign policy, national defense, taxation), frantic door-to-door canvassing, speeches at any podium a candidate can find, private appeals to donors both large and small, and the proverbial baby-kissing at every parade or state fair. For all that the process appears artificial or contrived and sometimes downright ridiculous and pandering, elections, as President Obama explained to the Republican Senate after declining to adopt any changes they proposed to his ObamaCare Act, “have consequences,” and these consequences can be serious for investors. As a result, we begin with a primer on the American federal election cycle.
Direct Elections (every 2 or 6 years)
Let’s begin with the most straightforward federal election cycle – the House of Representatives and Senate. There are 435 Congressional Representatives and 100 Senators.[i] The number of Representatives each state sends to Congress is a function of population size determined every ten years by a national census.[ii] The Senate is easier – each of the 50 states simply elects two senators. The number of Senators, as among the states, was intended to guard against the potential oppression resulting from population differences between any two states, like Montana and New York.
Both Congressional Representatives and Senators are elected the same way: by voters casting votes directly, either in-person or by absentee or mail-in ballots in each state, but the election cycles differ. The term of office for members of the House of Representatives is two years, with elections held both at the same time as the Presidential elections and halfway through the presidential term, in “mid-term elections.”[iii] This is a Constitutional requirement.[iv] Congressional Representatives are elected from districts in each state and are elected according to the count of the popular vote. Alternatively, senators serve for six years instead of two, and one-third of that body (Class I, II, and III) stands for election every two years, as per the Constitution.[v] Senators are also elected according to the results of the popular vote in each state. Since there are no federal term limits on elected service in Congress, and most incumbents, enjoying name recognition and franking privileges, are more likely to be re-elected, there is less turnover than one might expect in both houses.
One unfortunate effect of the short election cycles in the United States is that the election cycle has become dominated by the need to raise money. Congressional Representatives are widely understood to be in constant fundraising mode. This makes them susceptible to the corrosive effects of corruption and influence peddling, despite the strict laws that govern fundraising. Theoretically, the Senate, often termed the “millionaire’s club,” is less susceptible given the longer terms and that its members have traditionally possessed significantly greater wealth.
Indirect Elections (every 4 years)
The President of the United States (POTUS) is elected every four years, and this, by contrast to the direct elections decided by popular vote, is an indirect process. The votes to elect the POTUS are cast by the Electors of the Electoral College. The presidential election is held every fourth year on the first Tuesday after the first Monday in November.
Before we attempt to explain the Electoral College process, let us first review how one becomes a mainline presidential candidate. Candidates are selected in primaries that take place in each state and territory. Each party puts forward a slate of candidates for consideration by the voters registered as members of the said party – this year saw a particularly large number of potential Democratic Party candidates, ultimately resulting in the Biden-Harris ticket. The Republicans, holding the presidency, simply put forward the incumbent, President Trump, as a candidate for November 2020. Each party holds state-specific contests by which each candidate competes to win delegates who will then, theoretically, be pledged to vote for the selected candidate at the convention held by each party, usually in the summer before the November election. With the main party candidates selected by delegates at the convention, we can move on to the general election.
The selection of the POTUS is ultimately the task of the Electoral College. The Electoral College is not a physical place – it is a process overseen by the Office of the Federal Register, which coordinates certain functions of the Electoral College between the States and Congress. The Electoral College was created as a compromise in the United States Constitution between having a direct popular vote and a vote solely by the members of Congress. The College is made up of 538 Electors. The Electors are appointed from every state and from the District of Columbia in the same number as each state’s number of members of the House of Representatives and Senators (the census count thus becoming important again).[vi]
The vote cast by each person for President is actually a vote cast for a party’s slate of Electors on that first Tuesday following the first Monday of November every four years (or is a vote for the independent candidate’s Electors), even if it doesn’t appear that way on the ballot. Most states have a winner-take-all approach to the selection of the Electors, meaning that the competing Electors are selected according to the popular vote and the Electors associated with the winners of the popular vote become the Electors for each state (other than for Maine and Nebraska, which allows appointment according to the winner of each Congressional District and gives two electors to the winners of the state as a whole – allowing for split Elector distribution).
Each Elector is, without getting into the details, generally then going to vote for the candidate to whom that Elector was selected for. They are often required, either by state law or because of a pledge they made to the party when selected by the party as an Elector, to vote for the popular-vote candidate. Historically, over 99% of the pledged or promised Electors have voted as they had promised or pledged.
The popular election takes place, et voila, the media then reports (sometimes too early based on exit polling[vii]) who the next POTUS is. Formally, the world actually doesn’t know who the next POTUS is until January 6, after the Electors actually meet to cast their votes and after the Senate and the House of Representatives meet in joint session to count those Electors’ votes.
And that, in a nutshell, is how the Presidential election works in the United States. It may be confusing, it may result in legal challenges, it may even result in confusing explanations in major newspapers about the Electoral College and how it functions, and it may result in anguished cries about how the popular vote is disenfranchised, but you at least now have the facts to know how it works. Elections have consequences, but so do electoral processes. One thing that is helpful to understand about the United States’ process is that it has not, so far, resulted in riots or armed insurrection. Hopefully, that streak continues.
Norbury’s Presidential & Senate Forecasts
To arrive at our presidential election forecasts, we’ve split the states into three categories: one-party states where election history and recent polls point to a given win for either party, states generally regarded as “swing” by observers where we have assigned a 100% probability of either candidate winning based on our own analysis, and the remaining handful of battleground states where we have assigned various probabilities. With these projections, we are forecasting a 94% chance of a Biden presidency.
There are a handful of states on both sides of the aisle that nearly always vote a certain way. Two of the most obvious states are California and New York, where Democrats hold supermajorities in both state legislatures, and each of the past seven (eight in NY) presidential elections have gone blue. On the other side, there are historically red states with large poll disparities like Mississippi and South Carolina, where in each of the past 10 elections, both states have voted Republican. Altogether in this set of states, we count 20 states for President Trump totaling 126 electoral votes and 19 states for Vice President Biden, totaling 219 votes. A detailed list of these states can be found in Table 1 below.
The next set of states requires a more careful assessment to assign to any one candidate. The first of these states is Michigan, where we have assigned a win to Mr. Biden. Our first step was to find and assign a base rate for the probability of either candidate to win this state. We start from an understanding of the history of voting in that state. When looking back at the past twelve presidential elections, we see that the state has voted Republican 50% of the time and Democrat the other 50%. In 2016, the state voted Republican, electing President Trump by a margin of around 10,000 votes, which corresponds to 0.24% of voters[1]. Before 2016, Michigan had voted Democrat in six straight elections. Secondly, we aim to understand how new information can change our base rate. At the time of writing this letter, a weighted average of polls based on the quality of polls shows a 6.9% lead for Mr. Biden over President Trump in Michigan. This poll difference corresponds to more than two standard deviations beyond the margin of error. Combining this information, we are calling Michigan and its 16 electoral votes for Mr. Biden. A similar case can be made for nearby Minnesota, where the state has voted Democrat in each of the past 11 elections. To win the state, President Trump would need to turn approximately 45,000 voters (1.66% of voters1), but currently trails Mr. Biden by over three standard deviations (9.1%) in the aforementioned polls, and thus we are pledging the state of Minnesota and its 10 electoral votes to Mr. Biden. The last of the Midwest regional states in this part of the analysis is Wisconsin; in the previous election, President Trump carried Wisconsin by just under 23,000 votes or 0.82% of voters1. Like Michigan with whom they share a border, Wisconsin had elected seven straight Democrats before electing President Trump in 2016. At present, Mr. Biden enjoys a 6.7% lead in a weighted average of polls by quality, more than two standard deviations beyond the margin of error, and for this reason, we are calling Wisconsin and its 10 electoral votes for Mr. Biden. In New Hampshire, where Hillary Clinton won by 2,700 votes in 2016 (0.39% of voters1), Mr. Biden currently has a 9.5% lead in the aforementioned polls and the state has voted blue in each of the past four elections. With this in mind, we are forecasting New Hampshire and its 4 electoral votes to former Vice President Biden. Finally, we look at Texas, where polls have been historically tight between the two candidates. In 2016, President Trump carried the state by over 800,000 votes (9.43% of voters1) and the state has voted Republican in each of the past ten presidential elections. In the most recent weighted average of polls by quality, President Trump leads Mr. Biden by 2.3%, within the margin of error but gaining ground. Given the disparity in voter turnout in the last election and the historical significance of Texas’ Republican election history, we are currently assigning Texas and its 38 electoral votes to President Trump. Summing the results of our swing state convictions, the count is as follows: 40 additional electoral votes for Mr. Biden, adding to 259 total votes including the states from the first section, and 38 additional electoral college votes for President Trump, totaling 164 votes, including his states from the first section.
The seven remaining states totaling 115 electoral votes are: Arizona, Florida, Georgia, Iowa, North Carolina, Ohio, and Pennsylvania. Of these electoral votes, Mr. Biden only needs 11, a single-state win anywhere but Iowa, to assume the presidency while President Trump needs 106. In Arizona, former Vice President Biden would need to swing over 90,000 voters (3.78%1) from the 2016 election to win the state and while he currently leads in the weighted average polls, Republicans have been elected by the state of Arizona each of the past 5 presidential elections. This includes the last election cycle, where Hillary Clinton enjoyed a 3% lead in pre-debate polls and ultimately lost by 3.5% in exit polls; this is an indication that polls are not sufficiently reflective of the electorate in Arizona and as such, we are assigning a 15% probability of a Biden win in Arizona. Next is Florida, where Mr. Biden currently has a 2.9% lead in the polls, up from 2.2% last week; the last six elections in Florida have been split evenly between Democrats and Republicans. With President Trump having won by slightly more than 110,000 votes (1.24%) in 2016 and the electoral history of Florida, we are assigning a 50% probability of a Biden win in Florida. Onto Georgia, where polls are historically tight (current polls show a 0.6% Biden lead), but President Trump won by over 200,000 votes the last election. For Mr. Biden to win in 2020, he would need to swing over 5% of last election’s voters in a state that has voted Republican in each of the past 7 elections. Given historical precedent in the Peach State, we are assigning a 6% probability for Biden to win Georgia. In Iowa, where President Trump won by an astounding 150,000 voters (10.1%) in 2016, polls are showing him gaining ground. He is now 1.4% ahead of Mr. Biden in weighted average polls by quality, up from 0.4% last week. Although the past 6 elections have been split 50/50 between Democrats and Republicans, former Vice President Biden has a significant amount of ground to make up in 2020 and thus, we are assigning a 10% probability of a Biden win in Iowa. In North Carolina, where changing demographics are making a once-Republican stronghold an important battleground state, Mr. Biden currently enjoys a 1.4% lead in weighted average polls. Last election, President Trump carried the state by over 170,000 votes (3.81% of voters), but one of the two Democrats North Carolina has elected in the past twelve elections was President Barack Obama in 2008. With this in mind, we gave the chance of a Biden win slightly more weight and are assigning a 26% probability to Biden winning North Carolina. Next is Ohio, where like its midwestern neighbor Iowa, President Trump won in a landslide in 2016 (450,000 votes or 8.54%). Mr. Biden’s lead in weighted average polls has shrunk from 1.3% to 0.6% in the past week and the margin he needs to overcome is so wide that we are assigning a 15% probability to Biden winning Ohio. Finally, there is Pennsylvania, where before electing President Trump in 2016, the state had elected six straight Democrats. His margin of victory in Pennsylvania was less than 1% (about 45,000 votes) and Mr. Biden’s margin is currently 6%, twice the margin of error for polls. With this in mind, we are assigning a 75% probability of a Biden win in Pennsylvania.
By combining these probabilities, we arrive at a 94% probability that Mr. Biden wins the presidential race in 2020. Consequently, this means President Trump has a 6% chance of winning.
Turning to the Senate, where there are 35 seats up for election, the Democrats need to win 15 seats for a majority in the case of a Biden win (given the Vice President is the tiebreaker in the Senate) and 16 seats for an outright majority in the case of a Trump re-election. Using a similar framework to the presidential analysis, we use polls and historical data to make our forecasts and arrive at a result where 17 seats remain Republican and 11 Democratic. Interestingly, the leftover seats at the center of our election analysis all belong to incumbent Republicans and are from the following states: Iowa, Maine, North Carolina, Montana, Georgia (Class 2 seat), Colorado, and Arizona. By using data from the Good Judgment Project, we find that Democrats have: a 50% chance to win in Iowa, a 73% chance to win in Maine, a 66% in North Carolina, a 35% in Montana, an 83% chance to win in Colorado, and an 81% chance to win in Arizona. For the Class 2 seat in Georgia, incumbent Republican David Perdue finds himself in a historically tight election by Georgia standards and we see a 23% chance of a Democratic win.
Traditionally, the popular vote tends to be a good indicator of the composition in the House of Representatives. Given the current Democratic majority, consistency with which Representatives are re-elected, and Mr. Biden’s large lead in national polls, we are confidently forecasting a Democratic majority in the House.
Combining the senate probabilities with the presidential probabilities, we arrive at a 71% probability that Democrats achieve majority if only 15 seats are required, and a 37% probability if 16 seats are required. As it stands now, the combined probability of a Blue Wave, where the Democrats win control of Congress and the presidency, is 66.2%. Put in context, since 1972 (the past 12 presidential election cycles), the same party has controlled the House, Senate, and presidency only 25% of the time. Surely, the implications from a policy and governing perspective can be huge. We will be continuously updating these numbers in our weekly Special Reports on the 2020 US Election.
Possibilities Beyond Election Day
While we are forecasting a Biden win and a Blue Wave at the polls on Election Day, we are not ruling out the possibility of litigation or other issues past the day votes are cast; this particular election carries with it an enhanced risk of legal challenge. For different reasons, both parties are primed to think anything other than a clear landslide result will be something that may be tainted by fraud/suppression and will challenge that result. Under the circumstances where we are seeing problems with mail-in ballots and in-person voting due to the pandemic, it seems clear that we are at risk for a potentially sharp legal battle.
The most recent legal battle to look to for lessons is Gore v. Bush, when Albert Gore and the Democratic Party challenged the voting results in Florida which voted, apparently, in favor of George Bush. Voting laws are primarily creatures of state law and anyone who wishes to challenge the fairness of an election would start by filing in state courts in the state in which the challenge is to be lodged. However, and this is what we saw in Gore v. Bush, an aggrieved party at the state court level can apply to the United States Supreme Court for injunctive relief and to stay the state court proceedings. The Supreme Court has to first grant certiorari – in other words, accept the case. What may be different now is that liberal Justice, Ruth Bader Ginsburg, has recently died and the Court has not seated a replacement. This leaves the Court with 8 voting justices and while the Court could grant cert with just four votes, it may be deadlocked (4-4) on an eventual resolution of the full application. The deadlock would result in an effective denial of the application as the Court would not have a majority opinion.
This may be solved by quickly seating the current nominee – Amy Coney Barrett. The problem there is that the Senate must confirm her first and Republican Senators are currently testing positive for Covid-19, which may preclude their in-person attendance at the Senate to vote for her nomination. The margin for confirmation, assuming it goes by party vote, is narrow to begin with only 53 Republican Senators and 47 Democratic Senators (counting the two independent Senators who vote with the Democrats). Losing the attendance of four senators from the Republican side of the aisle could very well doom the Barrett nomination or at least delay it at a critical moment. This consequence of the pandemic – the inability to seat a judicial nominee – may have profound electoral consequences in ways no one could have imagined.
***
We appreciate you taking the time to read what we hope is the first of many commentaries on what we are seeing and learning. If you have any questions, please don’t hesitate to get in touch with one of us.
Sincerely,
The Norbury Partners Team
Table 1: “One-Party” States
Trump (Electoral Votes)
State
Biden (Electoral Votes)
9
Alabama
3
Alaska
6
Arkansas
California
55
Colorado
9
Connecticut
7
Delaware
3
District of Columbia
3
Hawaii
4
4
Idaho
Illinois
20
11
Indiana
6
Kansas
8
Kentucky
8
Louisiana
Maine
4
Maryland
10
Massachusetts
11
6
Mississippi
10
Missouri
3
Montana
5
Nebraska
Nevada
6
New Jersey
14
New Mexico
5
New York
29
3
North Dakota
7
Oklahoma
Oregon
7
Rhode Island
4
9
South Carolina
3
South Dakota
11
Tennessee
6
Utah
Vermont
3
Virginia
13
Washington
12
5
West Virginia
3
Wyoming
126
Total
219
Table 2: Current Norbury Projections
Trump (Electoral Votes)
State
Biden (Electoral Votes)
Michigan
16
Minnesota
10
New Hampshire
4
38
Texas
Wisconsin
10
38
Total
40
Table 3: Norbury Battleground State Probabilities
Trump (Probability)
State (Electoral Votes)
Biden (Probability)
85%
Arizona (11)
15%
50%
Florida (29)
50%
94%
Georgia (16)
6%
90%
Iowa (6)
10%
74%
North Carolina (15)
26%
85%
Ohio (18)
15%
25%
Pennsylvania (20)
75%
[1] that voted either Democrat or Republican (e.g., excluding Independent candidates)
[iv] Article I, Section 2, provides: “The House of Representatives shall be composed of Members chosen every second Year by the People of the several States. . .”
[v] Article I, Section 3, provides that: “[O]ne third may be chosen every second Year …”