Macro Minute: US Labor Participation

This week, we will once again touch briefly on labor force participation and attempt to make sense of the US Employment Situation Report from Friday.


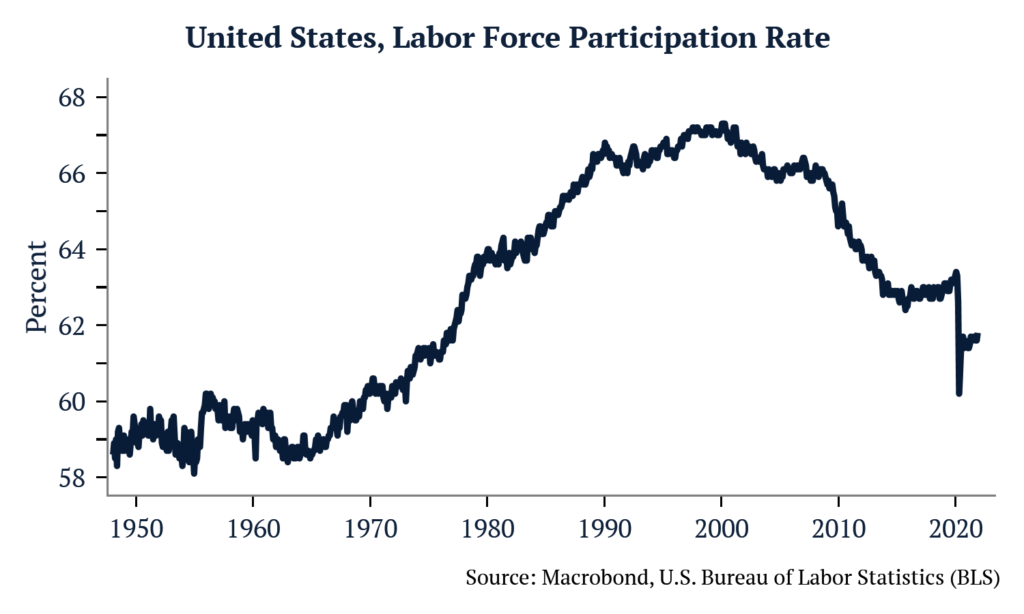
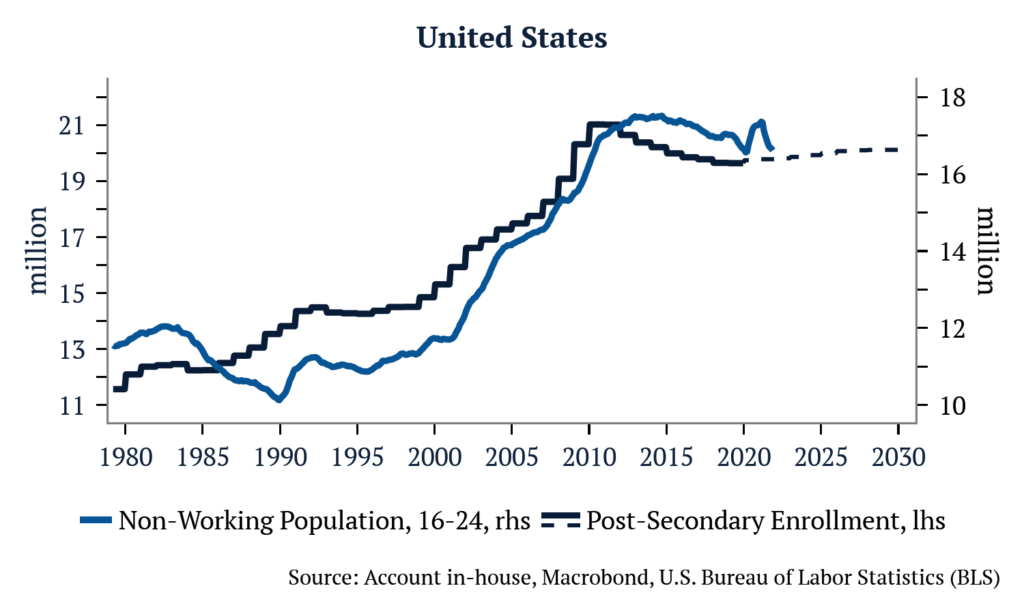
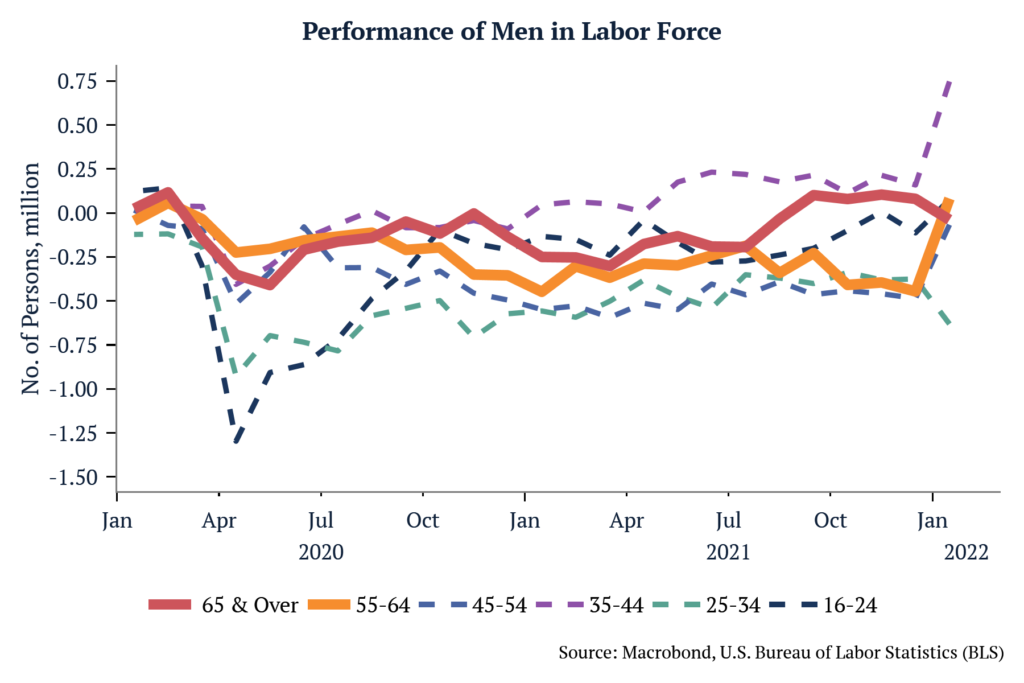
US labor force participation has been the subject of much discussion lately. Beginning in the 1960s when more women entered the workforce, it has steadily risen, moving from 59.1% to 66.9% by the year 2000. Since then, it has drifted lower and settled near 63% pre-Covid. A drop of almost 4% on the labor participation rate is equivalent to around 10 million jobs. At first glance this seems negative, but we find that most of this was due to strong levels of enrollment in post-secondary education among those aged 16 to 24. This trend began in the late 1980s, and accelerated into the 2000s, hence a deluge of social science majors and a dearth of truck drivers.

Turning to today, let’s analyze some of the most common arguments for explaining the slow recovery of the labor force participation rate.

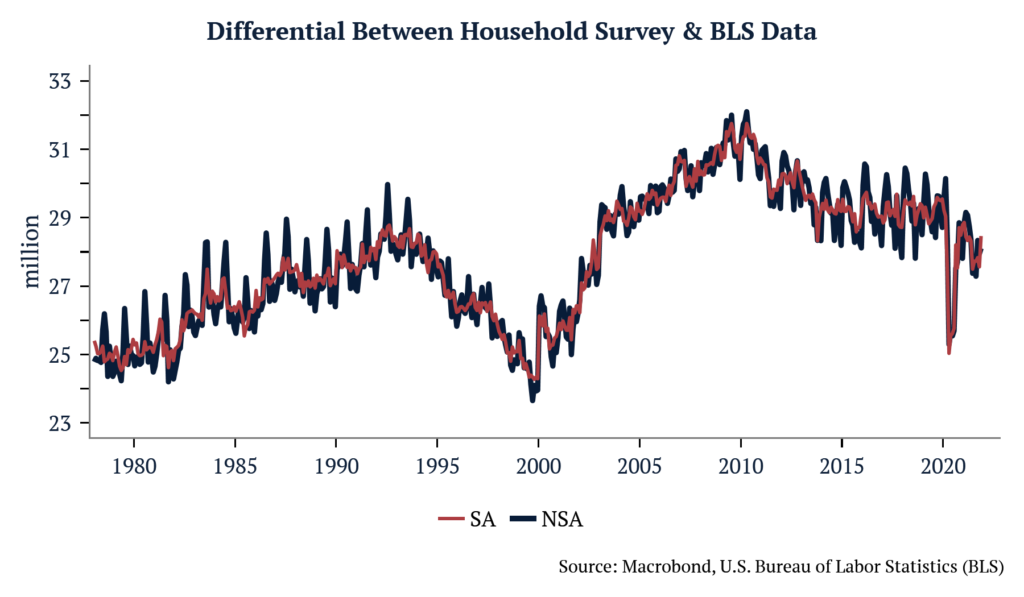
(1) Self-employment is keeping labor participation low – One way to try to test for that, is to track the difference between the household and the establishment employment data. The household employment figure captures the self-employed, farm workers and domestic help, something the BLS payrolls survey doesn’t do. Here what we find is that household employment suffered more than payrolls during 2020, and still hasn’t recovered to pre-covid levels.

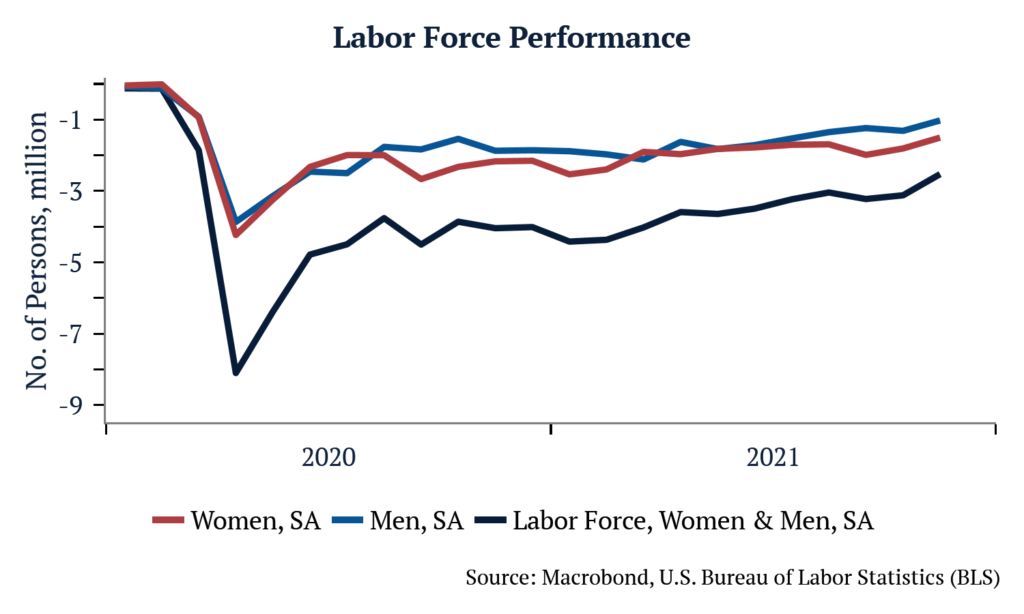
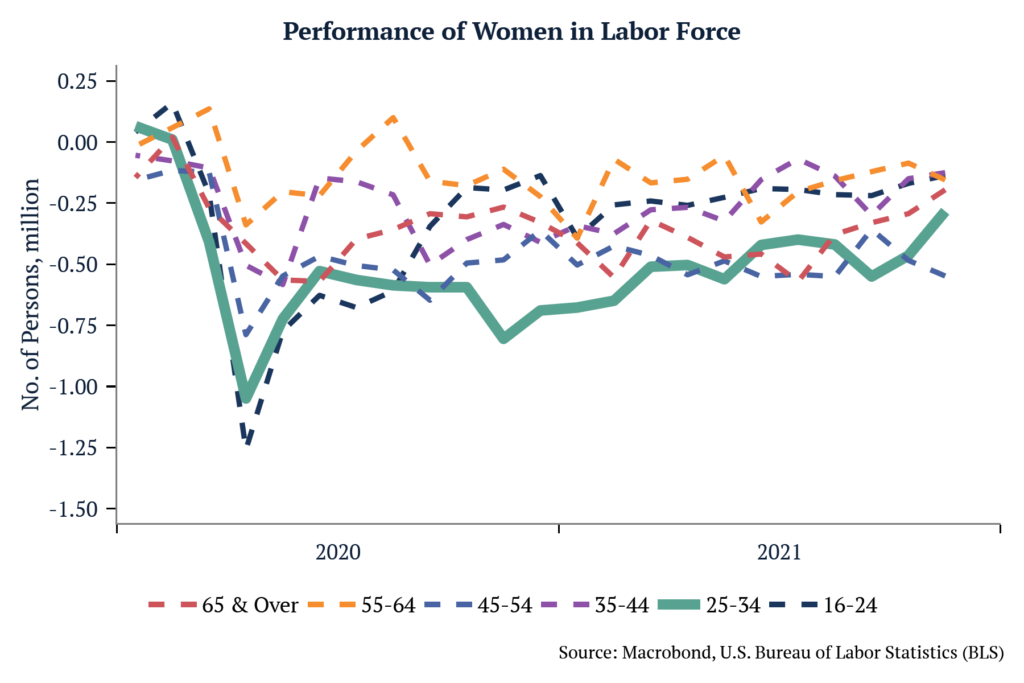
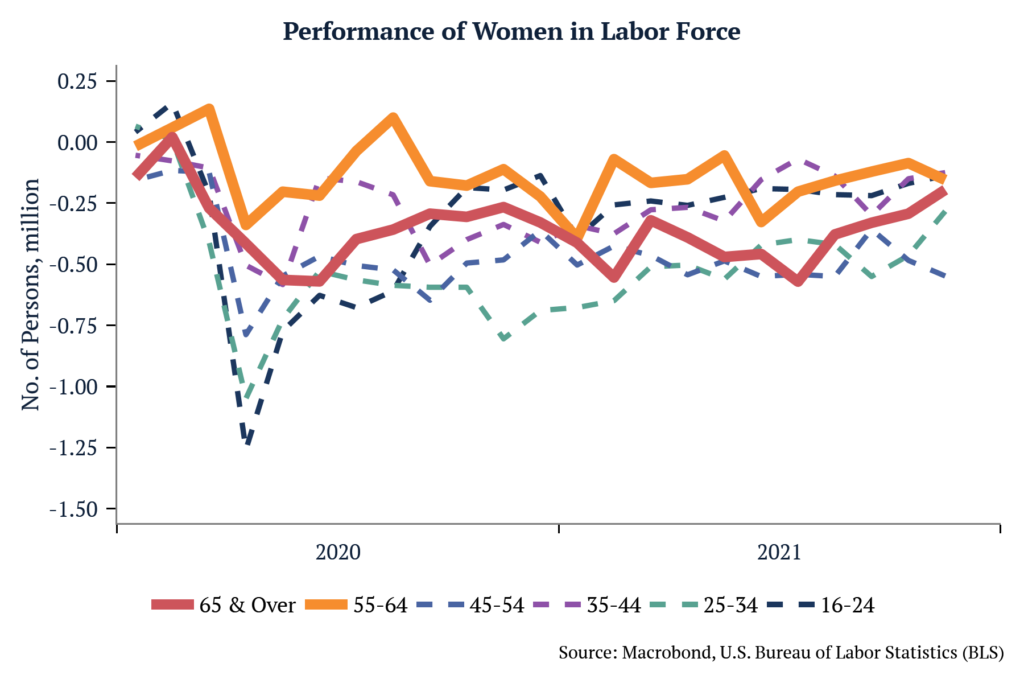
2) Women have been kept out of the labor force because of childcare – There is some indication this may be true. We saw nearly the same number of exits from the labor force for men and women in 2020 (3.9mm & 4.2mm in April ’20, respectively). Those aged 25-34 were the second most affected at the time, accounting for more than 1mm women exiting the labor force. By September 2021, there were still 550k less women aged 25-34 in the labor force than in January 2020, the largest discrepancy across all age brackets. With schools reopening, that number was cut in almost half to 283k in November.

(3) Retirement is keeping people out of the labor force – It is hard to see that clearly in the data. The age group 55 and over (55-64 & 65 and over), suffered the least in both genders and have the least amount of people out of the labor force (when compared to January 2020 levels). Today there is 100k more men 65 and over in the labor force than at the peak in January 2020.

Macro Minute: What to Make of Omicron

The emergence of the Omicron variant undoubtedly increased the risk of a repeat in lockdowns and restrictions the world saw in 2020. Markets started pricing a higher probability of a significant negative impact which we experienced last Friday, November 26th.

We are tracking the developments of the Omicron variant very closely and have begun reducing risk accordingly. Having said that, we believe that there are a few indications that this new variant also increased the upside scenario for the markets, and even more importantly, for global health.


By now, most people are familiar with the downside case the new variant represents. With more than 30 mutations of the spike protein alone (Delta variant had 9), the Omicron variant could be a severe risk to global health. 8 of the Omicron mutations have never been seen before and 9 have been seen in other variants of concern. Lab data suggests that some of the new mutations are a threat and other mutations are still being examined. Some mutations have properties that lower the efficacy of current vaccines, while others show potential for increased transmissibility.

There are  also other indicators that we are currently tracking. The majority of the hospitalized cases are still in unvaccinated people (South African Health Ministry identified that most of the cases seem to be in < 50-year-olds, where the rate of vaccinations are low <20-25%, and also likely that some of these would be immuno-compromised with HIV, etc.). However, it is unclear how many had natural immunity from previous infections.


It is too early to say, but the lack of a surge in hospitalization rates in South Africa combined with early anecdotes of mild symptoms and the knowledge that this variant has had numerous mutations gives rise to the possibility of it becoming a less deadly virus. If this is the case, it could translate into much lower hospitalization and fatality rates. Combine that with higher transmissibility and increased infectivity, and we might just be staring at the light at the end of the tunnel. If this variant is less severe but much more contagious, we could quickly move toward a flu-like endemic illness.


Nevertheless, one of the most interesting pieces of information that came out last week has been given little to no attention. The Omicron variant, unlike other variants, can be tracked via a simple PCR test and will not require genomic sequencing to identify. The reason this is so important requires a practical understanding of how statistics are generated during a pandemic.


The primary source of risk arising from any pandemic is hospitalization and fatality rates, but it is tough to have an accurate number as the infection spreads (and even after it is over). Let’s use fatality rates as an example. The most common approach is to have confirmed deaths associated with the virus (a reasonably reliable indicator in most cases) divided by the number of cases (varies depending on how this is captured). The denominator could be counting only laboratory-confirmed infections, all people who displayed symptoms but were not tested, or the total number including asymptomatic cases. As expected, laboratory-confirmed cases (lowest denominator) yield the highest fatality rates.


The fact that a simple PCR test can detect the Omicron variant does not completely fix the denominator’s problem. However, within laboratory-tested cases, it will make comparison with other variables much faster and efficient. If we find that this new variant has a much lower fatality rate, policies will have to adjust for the new reality, and the risk of a repeat in lockdowns and an even bigger health crisis dissipates. We will learn more in the next couple of weeks.

Divestment Is Not The Answer: An Easy Way Out Of A Complex Problem

Divestment, the act of removing and or excluding particular sectors or segments of the market from investment portfolios, was all the rage at the beginning of the last decade in the face of climate change. Based on my perspective, however, the results of such action by institutions and portfolio managers have been uninspiring.

For citizens of a democracy, voting is the most important action one can take toward shaping the future path of economic and social policy in his or her municipalities, states and nations. George Nathan, an American editor in the early- to mid-1900s, has been credited with saying, “Bad officials are elected by good citizens who do not vote.”

A case can be made that the same level of responsibility held by voters in a democracy sits with the market when it comes to shaping a company’s business decisions. Shareholders, irrespective of size, are typically entitled “to vote in elections for the board of directors and on proposed operational alterations such as shifts of corporate aims and goals or fundamental structural changes,” according to Investopedia. When you consider the democratic tradition of voting to make a change, particularly in American culture, it is hard to “square the circle” when it comes to supporting divestment.

However, recently, the trend seems to be shifting. This year, shortly before Memorial Day, the board at Exxon “conceded defeat” to impact investment firm Engine No. 1, which drummed up (and won) a proxy fight by alleging the company was being disingenuous with its emissions targets and not taking its impact on climate change seriously enough. Through a combination of publicity and engaging with large shareholders, the newly launched firm used activism to, against the recommendation of Exxon’s executives, elect three candidates to the company’s board who are committed to pushing the company’s business model away from fossil fuels and toward renewable energy.

As an investor, one should strive to understand as many of the components of risk that will impact a company’s (or country’s) future rate of growth and ability to operate efficiently. We founded Norbury Partners, a sustainable macro fund, on the premise that it is impossible to make informed investment decisions without considering changing consumer preferences, as well as changes in the regulatory and policy environment arising from climate change mitigation and adaptation and access to basic services. However broad, certain sustainability information can be material to better understand macroeconomic variables and the idiosyncratic risks associated with countries and the future cash flows of corporations.

From severe flooding in low-lying cities caused by mega-storms to drought-stricken commodity harvests, and everything in between, it has become increasingly clear that fundamental data found on company 10-Ks, or in periodic sovereign data, does not always wholly paint a picture of the future. Like people and their voting habits, companies and countries change with the times. Look at the past six months: the United States rejoined the Paris Climate Agreement and the largest economies in the world committed to net-zero targets within the next 40 years.

Rather than divest, rational investors seeking to maximize their returns should look for companies in the early or interim stages of change that will create outsized value in a changing world energy paradigm. Often by the time companies mature, becoming renowned for their sustainability practices and stalwarts in environmental, social and corporate governance (ESG)-focused portfolios, the excess value created when a company managed its downsides and built upside has already been priced into the stock.

Furthermore, what industry is going to see a more significant shift in the changing world paradigm? Someone will have to provide the innovation and energy required to power a growing, more technology-centric world. By participating in a company that has long been called for divestment, Engine No. 1 has demonstrated that investors have a better chance of shaping the future and capturing upside for themselves as active shareholders than they do as spectators in the market.

Finally, the nature of markets guarantees that by divesting, particularly on a large scale, prices will be pushed down with more sellers than buyers. This, in turn, increases the expected return for divested company shares where business will continue as usual, bringing non-ESG-focused investors into the fold who are less likely to make the required changes (or vote along those lines) for a sustainable future.

By last fall, more than 1,200 institutional investors, with more than $14 trillion in assets, had made commitments to the divestment of fossil fuel holdings. Yet, the way I see it, the movement has failed to bring about the change it has been lauded to produce.

As citizens of a democracy, it is our right and our duty to exercise our vote in order to institute change. As investors, we should be looking for the upside to be found in energy companies transitioning to technologies more suitable for the future that policymakers have committed to. And as students of markets, we must recognize that by divesting shares and pushing prices down, we increase a stock’s expected return, thereby inviting marginal investors less committed to ESG and a sustainable future as shareholders, and creating a feedback loop of “more of the same,” with little prospects of advancing toward our goal.

Voting should not be something we talk about every four years. Utilize your ability to be an active market participant to drive the change you want to see.

Article also submitted to Forbes

Macro Minute: Commodity Inventories

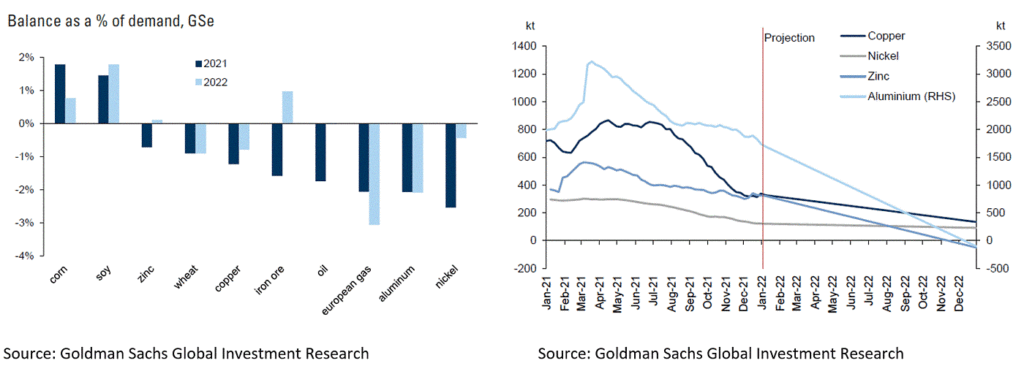
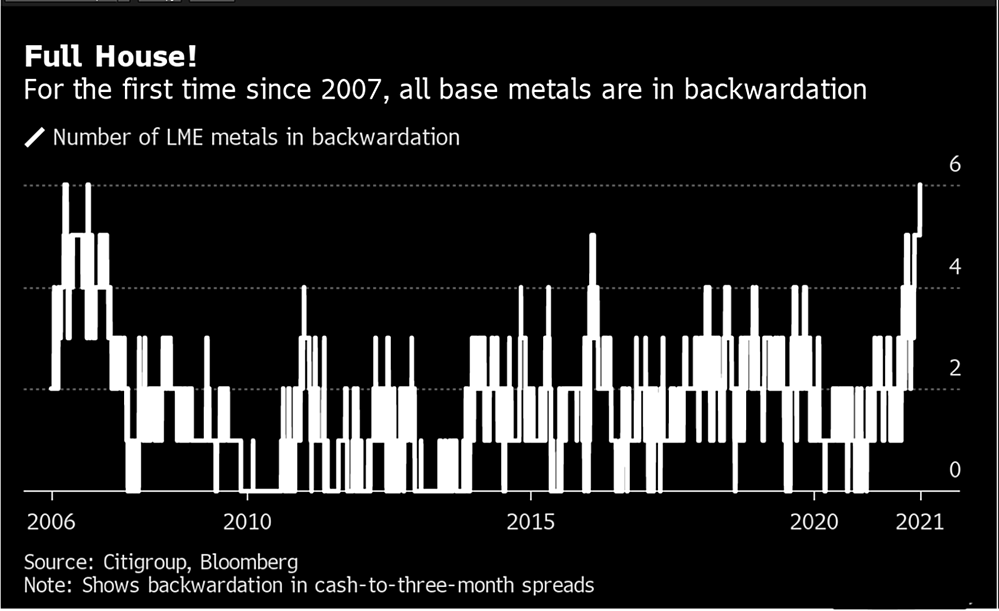
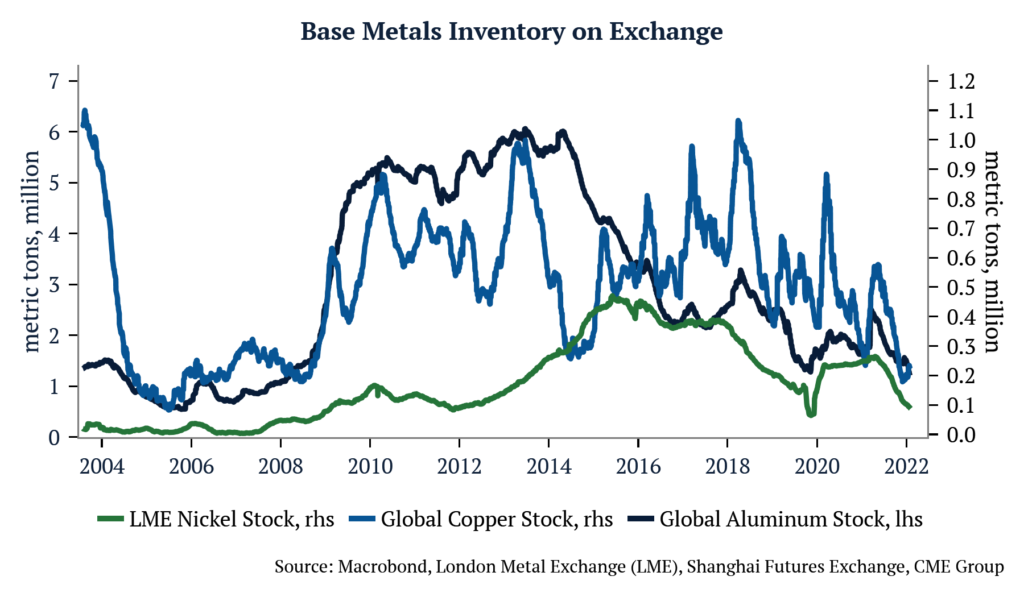
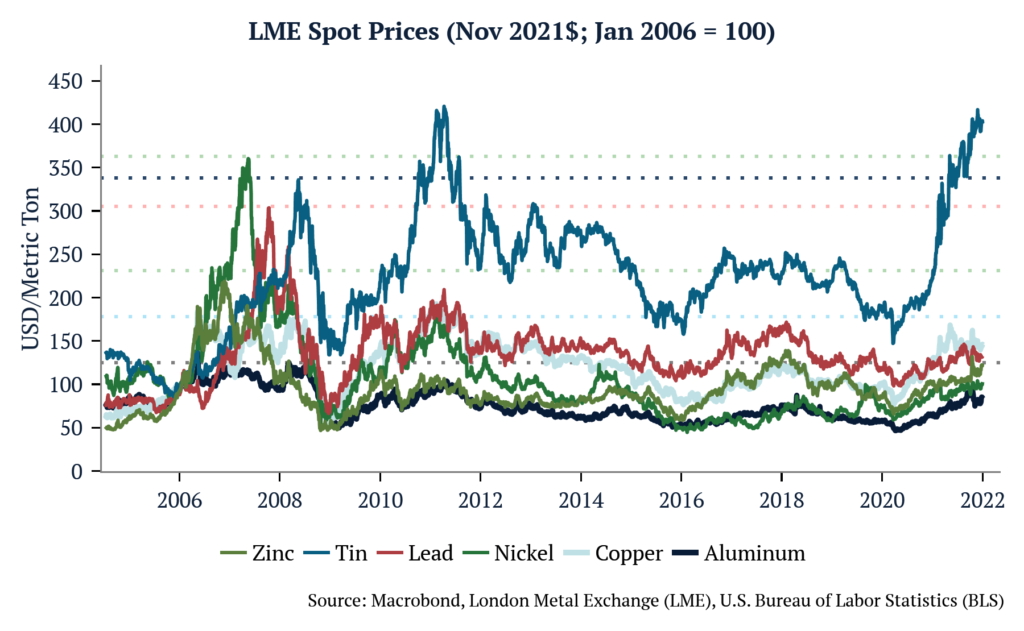
A quick note on commodities… Historically tight inventories have led to all six base metals (Aluminum, Copper, Nickel, Lead, Tin, Zinc) listed on the London Metals Exchange to trade in backwardation for the first time since 2007.

Of those six, some of the tightest markets are in Aluminum, Copper and, especially, Nickel, which has the largest deficit in its history. Using the average daily production of each metal and aggregate inventories across Shanghai, London, and United States metal exchanges, we estimate global aluminum inventories to be approximately 5.8 days of production, copper at 2.2 days of production, and nickel at just under 13 days of production. Actual daily draws from exchange are variable, but this illustration speaks to the level of tightness in the market.

All but tin have upside to the levels reached in the last period of backwardation across the sector, after adjusting metal prices for inflation.

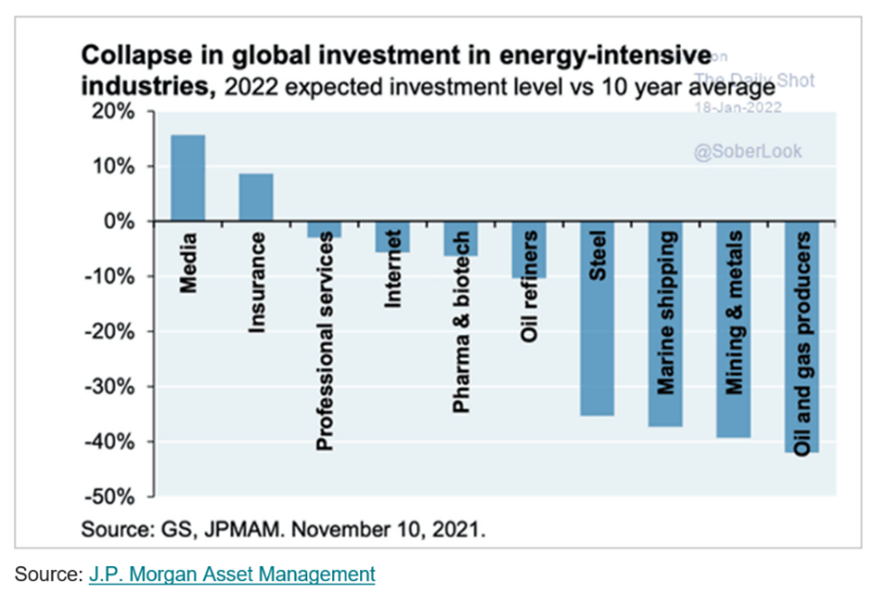
Bear in mind that while the price run-up in 2007 was also the result of a supply shock, albeit for different reasons, there was a sharp decline in demand caused by the bursting of the housing bubble and onset of the Great Financial Crisis, just as more supply began to come to market. The setup this time appears to be different. Persistent underinvestment in commodity extraction over the past decade, coupled with increased demand driven by government net-zero goals rather than private industry (e.g., homebuilders), suggest that this rally could be much tighter for much longer. With EV penetration increasing around the world, including in China, where nearly 20% of new car sales are electric, and the fact that those vehicles require between 5-6x more metal than internal combustion engines, we could see pressures drive prices past 2007 levels.

Macro Minute: Fiscal Cliff vs. Excess Savings

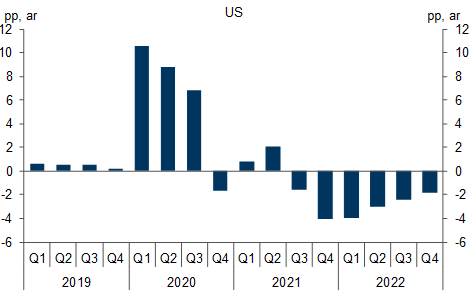
Looking ahead to 2022, much has been written about the pending fiscal cliff and its impact on Real GDP Growth. As the impact of fiscal stimulus dissipates and the federal government mulls tax increases, analysts expect fiscal impulse to shift from positive to negative next year.

Figure 1: Effect of Fiscal Policy on Real GDP Growth (3Q CMA) [Source: Goldman Sachs]

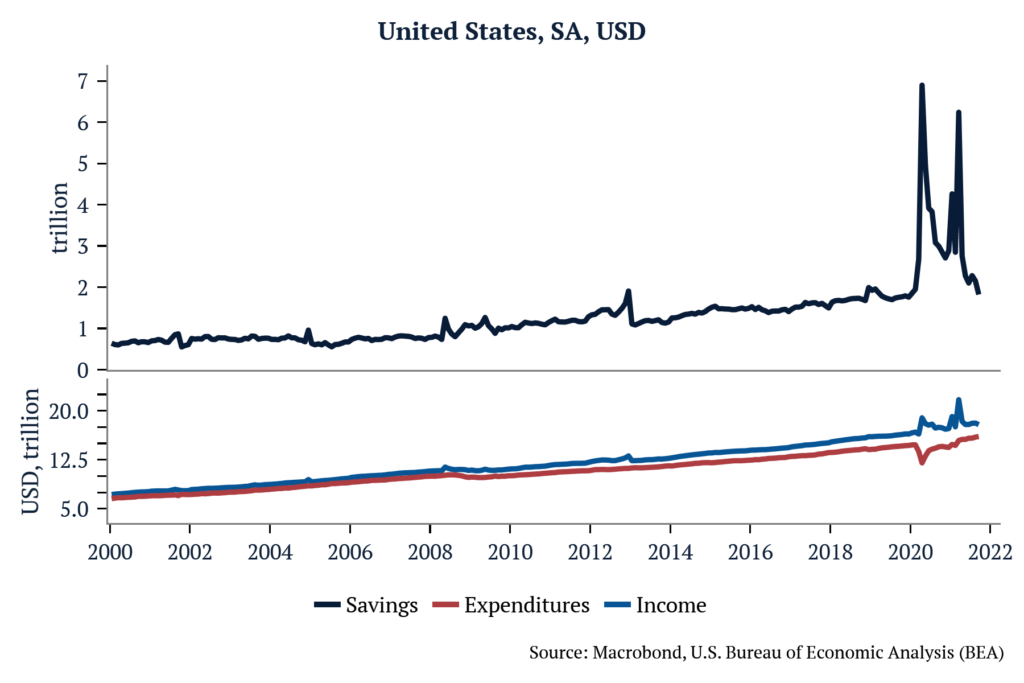
In our estimation, given the levels of excess personal savings reached in the past 20 months, we believe there is enough pent-up savings to compensate for the forthcoming negative fiscal impact on GDP. Using seasonally adjusted personal income minus personal consumption expenditures as a proxy for personal savings, we find that from April 2020 through September 2021, Americans generated over $2.8 trillion in excess savings, amounting to approximately 12% of GDP. That compares with approximately 4% of fiscal drag projected for 2022.

Macro Minute: What’s going on in the US Labor Market?

With job openings, participation rate, and unemployment central to the current discourse on markets, the topic of this month’s memo is the United States labor force.  

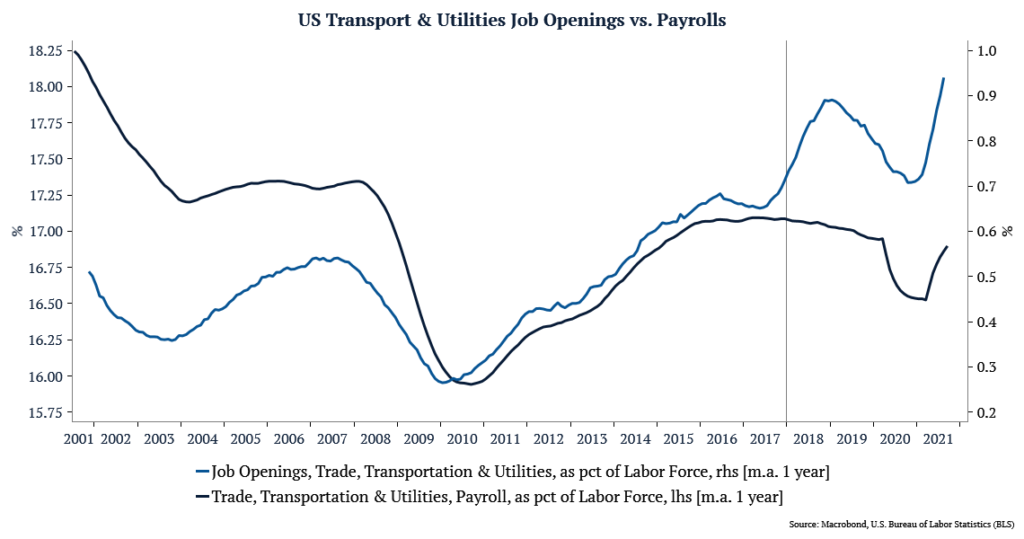
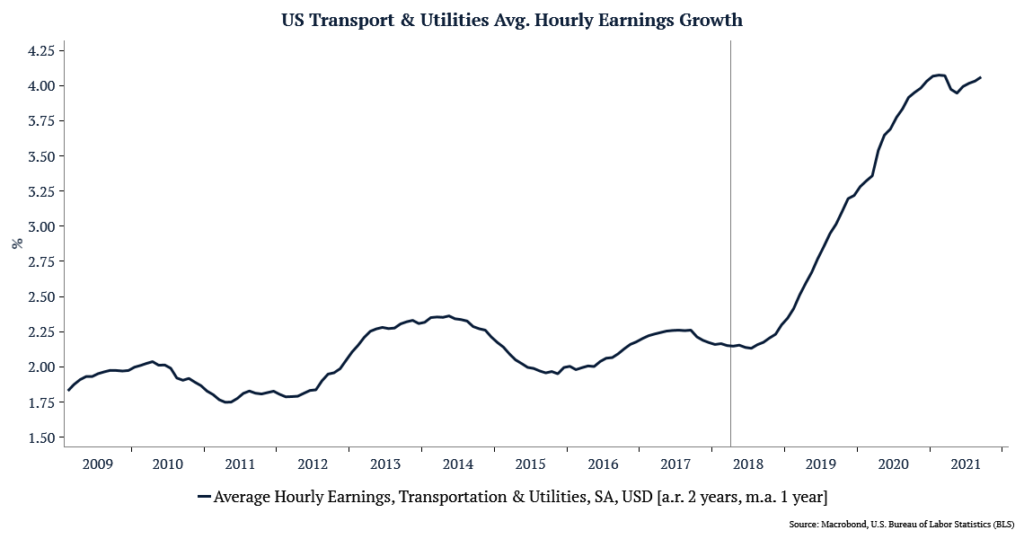
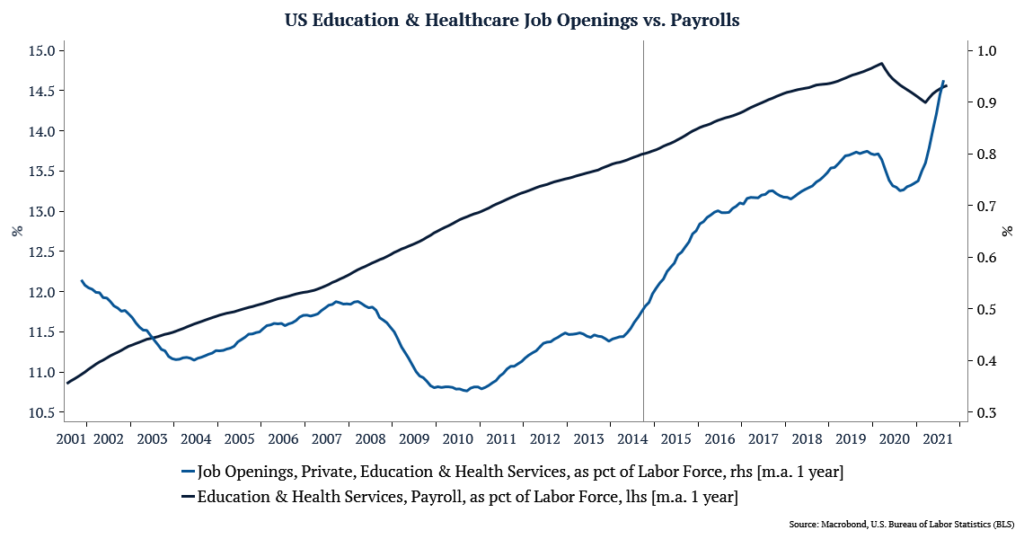
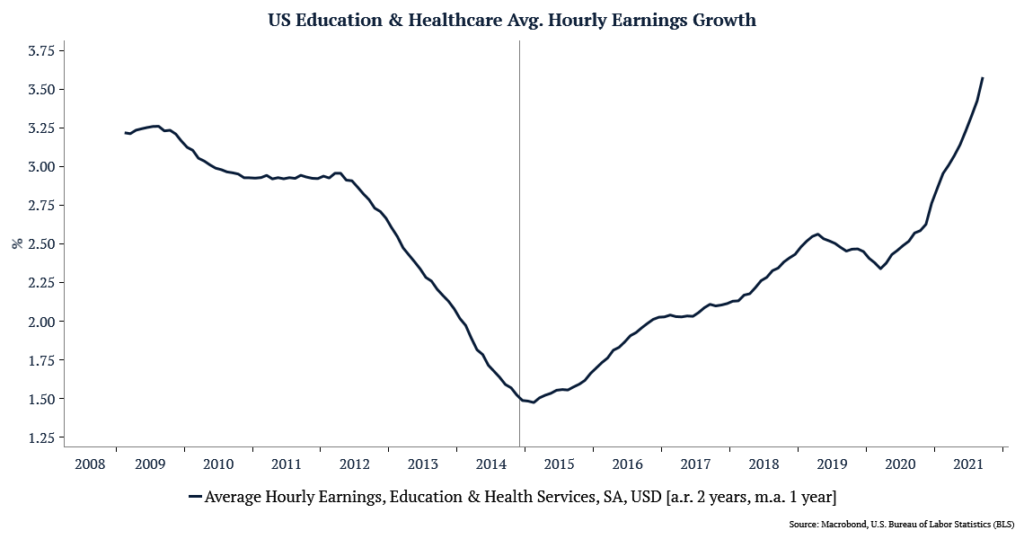
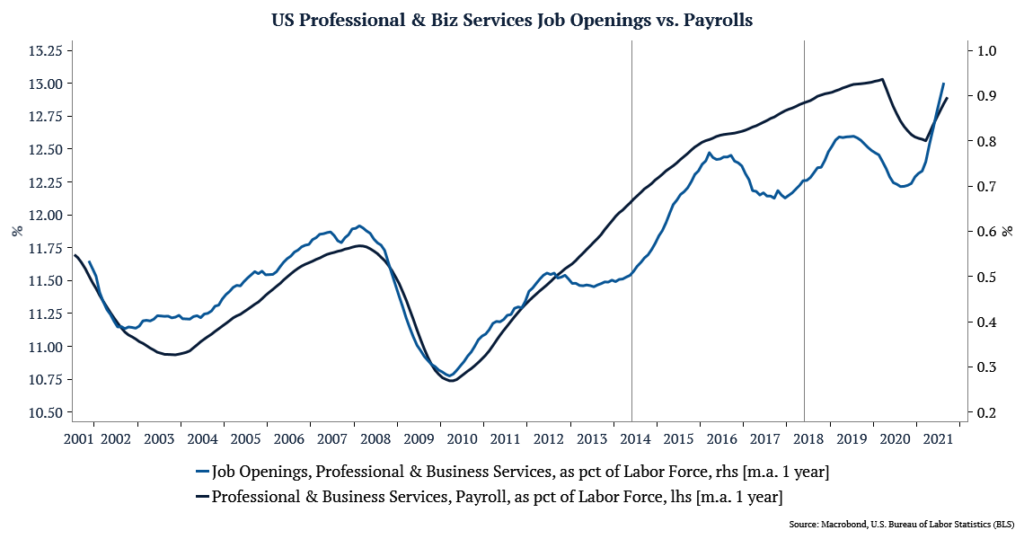
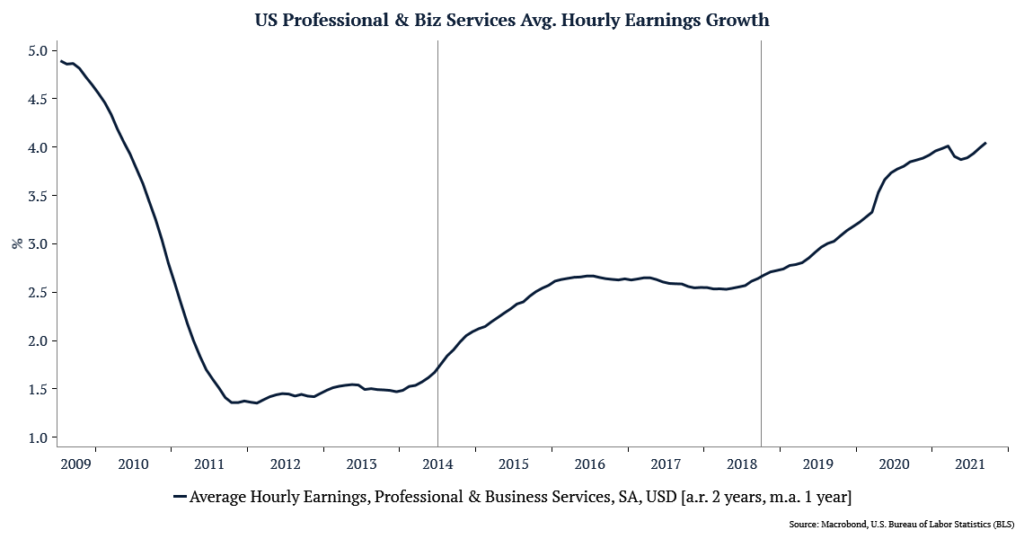
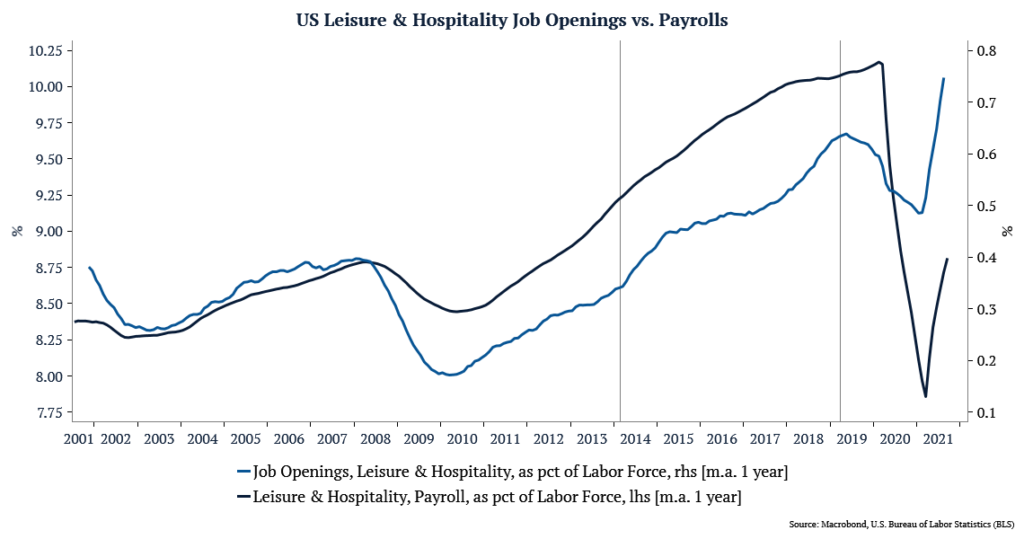
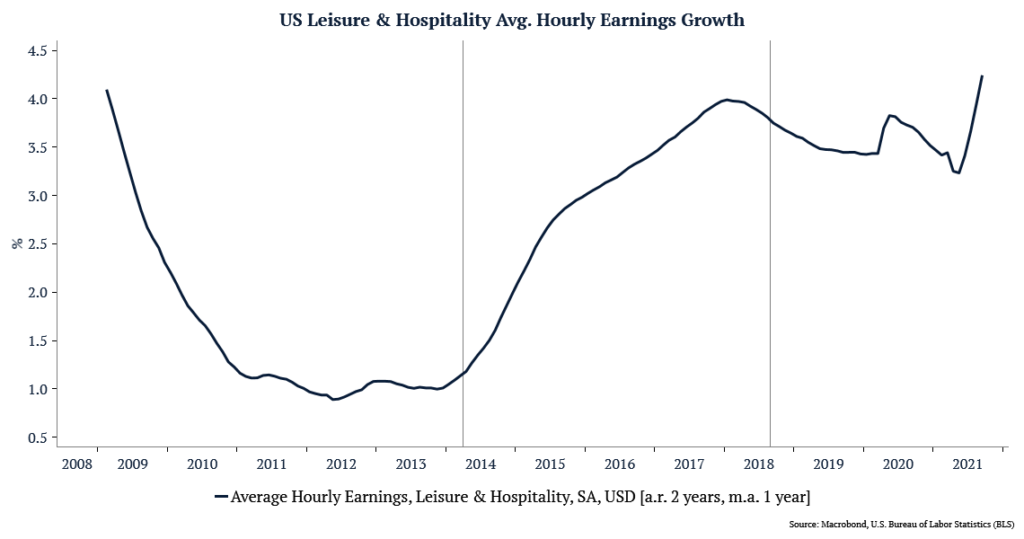
Focusing on the four largest sectors (which add up to more than 60% of payrolls and job openings in the US economy), we can see that wage inflation is a pattern that predates the onset of covid. In other words, wage inflation is not simply a result of covid supply shocks, it is based on fundamentals in the economy, and therefore it is not transitory. 

1 – Trade, Transportation & Utilities (19% of total Payrolls, 18% of total Job Openings)  In 2018, demand for work (job openings) started to grow much faster than supply (using payrolls as a proxy). As a result, average hourly earnings growth for this sector has surged from an average of 2.25% percent in 2018 to over 4% today (and 3.35% pre-covid). 

2 – Education & Health Services (16% of total Payrolls, 18% of total Job Openings) Hereto the story is very similar, but it started even earlier. In 2014, demand for work accelerated faster than supply of workers, driving an increase in earnings from 1.5% to 3.4% today (and 2.5% pre-covid).

3 – Professional & Business Services (14% of total Payrolls, 18% of total Job Openings) In Professional & Business Services, we saw two waves. The first in 2014 and the second in 2018, causing an increase in earnings from 1.5% to 2.3% in the first wave, and from 2.3% to 4% today (and 3.3% pre-covid).

4 – Leisure & Hospitality (10% of total Payrolls, 14% of total Job Openings) Leisure & Hospitality is the only sector in the top 4 that has gone through two opposite cycles since 2014. The first was with the demand for work growing faster than supply starting in 2014, increasing earnings growth from 1% to 4% in 2017. The second cycle took place starting in 2018, with labor supply growing faster than demand, and earnings growth falling to 3.5%. Today we are back at 4% growth, last seen entering 2018. It is worth noting that today, the demand for work in this sector is at historical highs while supply is back near the levels of 2010.

Labor Supply Shock

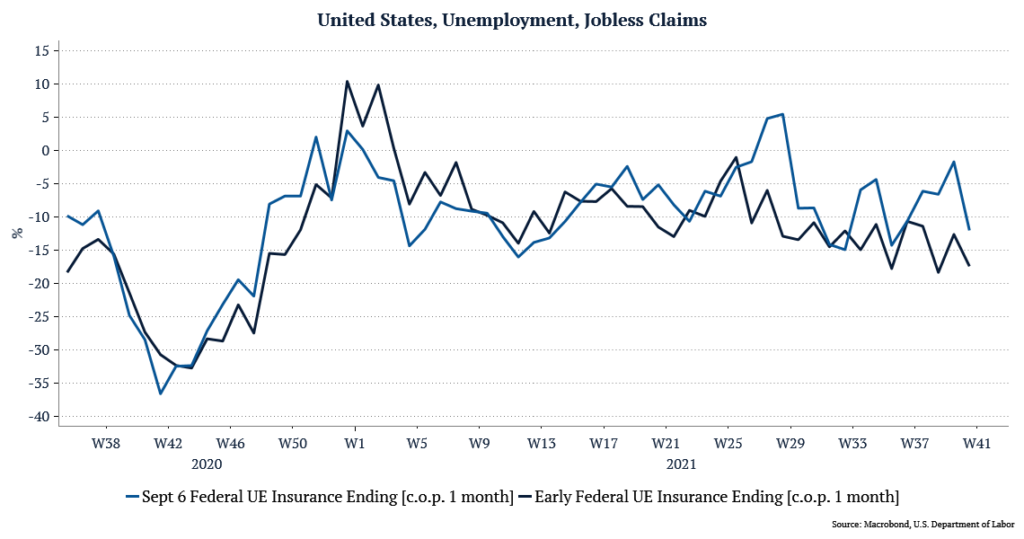
The last point has to do with the temporary labor supply shock that happened due to covid. Comparing jobless claims numbers between states that ended extra unemployment benefits before the September 6th deadline and those that adhered to the target, we see that the states that finished earlier have a much more accelerated and consistent contraction in claims across latter weeks. With this in mind, we expect some of this labor supply shock to normalize as we get farther from the deadline. However, when we look at the pre-covid trend, we believe that this will not be enough to avoid wage inflation.

Special Report – A Changing Paradigm

As an investment philosophy, we believe that the best way to deliver above-market returns is to find something cheap, take a position, and hold it for the long term. We tend to avoid market timing and “short-term” investments.

Looking across asset classes, we find that many equities are overpriced on a historic basis by virtually every metric and expect future returns to be much lower than in the past decade, save for a couple of undervalued sectors like energy and materials. When the stock market is on fire, as it has been almost non-stop since 2008, investors ignore companies that specialize in raw materials and other goods. With investors too distracted by their ever-increasing portfolio of technology companies, there was a loss of interest in investing any money in increasing the productive capacity of raw materials, agricultural products, and other hard assets.

In real estate, housing around the world is already too expensive to represent a compelling investment. In the US alone, the S&P Case-Shiller Home Price Index sits a lofty 26 percent above its 2006 peak, with a 17 percent increase year-over-year for the nine US Census divisions. To put this in context, housing prices have been rising more than 5 percent above inflation for the past decade.

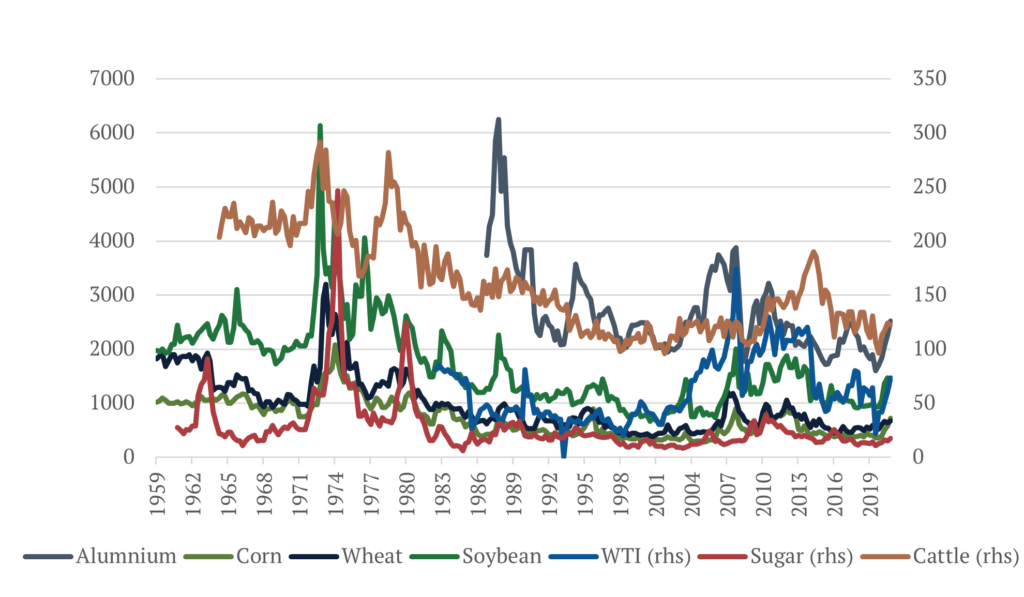
Products like copper and lumber seem expensive but as an asset class, commodities are the cheapest. When you factor in inflation, even after the recent run up in prices, most commodities are trading closer to their historical lows. We will further explore this asset class in detail in future reports.

Figure 1: Inflation-Adjusted Commodity Prices

Bonds have never been this expensive in history and are clearly in a bubble. As we write this letter, 10-year real yields in the United States are at their historical lows of -1.2 percent. With the Fed’s new inflation targeting policy of slightly above 2 percent, real rates could still theoretically go down to somewhere slightly below negative 2 percent, assuming the Fed cannot reduce nominal interest rates meaningfully below zero. However, for that to be true one needs to accept that we are living through some type of global secular stagnation[1] process, from the demand or the supply side.

Herein, we hope to show that such a scenario is extremely unlikely. First, we believe it highly probable that the environment of slower growth and inflation from the past few decades has more to do with a series of temporary “headwinds” arising mostly from consecutive deleveraging processes caused by the fact that almost all recent crises were balance sheet crises, and therefore deflationary. Secondly, we argue that even if we were living through secular stagnation before, we are not anymore. The underlying forces in play for the past few decades began reversing around 2015, and the Covid crisis created a catalyst for an acceleration of these forces.

If you wish to receive a full copy of this report, including our directional views across asset classes, please contact [email protected].


[1] Secular stagnation is defined as a prolonged period of low growth. While prolonged and low are not further specified, many economists define low as an average annual real output growth rate of no more than one to 1.5%, and prolonged as covering at least several business cycles. The term secular does not require stagnation to persist forever.

Foreign Investment-Friendly Policies Could Make Brazil The Country Of The Present

“Brazil is the country of the future and always will be” is a quote often attributed to Charles de Gaulle that I particularly dislike but find hard to dispel.

From the early 1500s to 1930s, Brazilian GDP growth was merely a function of population growth, with annual population growth rates ranging between roughly 0.5% and 2%. It was only when government efforts to industrialize the country materialized in the 1940s that growth rates detached from population growth, with a meaningful increase in productivity that would only end with the hyperinflation period of the 1980s, resulting in a period of GDP per capita contraction. The seeds planted in the early years of industrial policy still pay dividends to this day through companies like Petrobras, Vale and CSN, as well as the National Bank for Economic and Social Development.

Until the 1970s, Brazil’s industrial policy was focused on opening its borders to attract foreign investment, which set it apart from many countries in Europe and Asia. The end of the expansion coincided with the oil embargo of 1973 and pushed the country into stagflation with high levels of debt and interest rates. It was only when the military dictatorship ended and democracy returned that the focus shifted to fighting inflation and economic development. By then, international competition was fierce, with China’s working-age population surpassing all developed markets combined. In many ways, the country was too early to reap the extraordinary benefits that globalization provided to emerging markets beginning in the 1980s. The disparity in emerging markets can be seen by comparing different countries’ economic complexity indexes. From 1998 to 2019, Brazil moved from 24th in terms of economic complexity to 49th in the world, while China impressively leaped from 72nd to 29th. The result was more successful in fighting inflation than implementing an effective industrial policy.

However, all is not lost. True, GDP per capita in Brazil was over nine times higher than in China in 1990, and in 2019 was about 85% the size of China’s, with expectations of decreasing further in the coming years. But, this loss in income has also made the country more competitive. Since 2011, labor costs in Brazil have decreased, and the OECD projects those costs to be slightly lower in 2022. In China, unit labor costs have steadily increased since the Great Financial Crisis and are materially higher than in Brazil at present, with projections implying further divergence between the two countries. When compared to Mexico, although labor costs are also trending down, Brazil still has one of the most cost-competitive labor markets in emerging markets today.

Along with cheaper labor costs, Brazil is in a great place to benefit from sustainability megatrends and international net-zero emissions goals. As the world moves toward net-zero, policies such as a carbon border adjustment tax are increasingly likely. Such a tax would mean that goods produced in countries where most of the electricity is generated from carbon-based fuels will cost more for producers, leading profits-first exporters to search for alternative manufacturing bases. Countries with mostly renewable electricity should benefit from significant capital inflows. Brazil generates 83% of its electricity from renewable energy, most of which comes from hydropower. The government has stated plans going back to 2016 to expand the share of renewable alternatives in its energy mix — wind has the greatest potential in the dry season as a hedge against low rainfall limiting hydropower productivity. Specifically, the 10-year Brazil Energy Plan from 2016 called for 18.5 GW of additional wind capacity by 2026. As of March, there was 17.7 GW of wind capacity installed in Brazil, leading it to be ranked eighth in the world for total wind capacity installed. This compares to China, India and Mexico, where only 29%, 22% and 21% of electricity production are from renewable sources, respectively.

Brazil still needs to improve its economy if it wants to compete with these countries to attract capital flows effectively. In 2020, the World Bank ranked Brazil 124th out of 190 countries regarding ease of doing business, compared to 31st for China and 60th for Mexico. Brazil ranked in the bottom third when it comes to registering property and starting a new business. The country was only better than six out of 190 countries when it comes to paying taxes, and ranked 170th for dealing with construction permits. By making even minor improvements, the region could be much more appealing to international investors. One place to start could be in reducing the administrative burden and time for companies to solve issues across these metrics, as this was a recurring theme in the data.

Historically, high interest rates have curtailed investments in Brazil. With rates materially lower, greenfield projects should be easier to pencil in the nation as companies look to diversify supply chains and protect their margins. This lower interest rate environment also opens new possibilities for industrial policies. Brazil could borrow a page from the Self-Reliant India playbook. The Indian government will spend $28 billion to subsidize manufacturing in the country by allowing manufacturers that hit investment and production targets to apply for cash back worth 4%-6% on incremental sales above their turnover for up to five years. This policy encourages foreign businesses to move manufacturing to India, produce goods for export and earn an incentive. This is not unlike the path China took to build its manufacturing base — initial Chinese export success relied heavily on foreign investment in clusters where domestic operators could grow alongside foreign competitors. Companies such as Apple, Amazon and a Foxconn subsidiary have already announced production plans in India. Such a foreign investment-friendly policy stance from Brazil could be monumental for the country’s manufacturing base and allow the country to emerge as a critical piece of a diversified, green global export regime.

If the country can seize this opportunity, it would finally put to rest the idea that success is an ever-moving target and make Brazil the country of the present.

Article also submitted to Forbes
2021 Annual Report

When observing macroeconomic trends, we separate our thinking between short-term credit cycles and the impulses impacting them versus slower-moving, long-term credit cycles and the prevailing policy drivers for their behavior. A tertiary layer that has been gaining steam for the better part of the past decade and is now firmly entrenched as a key driver of economic activity, market behavior, and our investment theses is sustainability. As we look ahead into 2021, we believe that we are at, or very near, a rare inflection point involving each of the three aforementioned factors that will reshape the landscape for investors globally. In the subsequent sections, we will discuss at length our views on each of these three pillars, but a summation of the key points can be found below:

  • The coronavirus pandemic caused the sharpest contraction of United States GDP and rise in unemployment of any recession since the Second World War, which resulted in an unprecedented level of fiscal and monetary support in most developed markets.
  • A combination of vaccination rates and the effects of the policy response has created an environment where cyclicals and services could benefit from the large increase in excess household savings and the most pent-up demand since the 1920s.
  • Commodities will play an important role in all of our investment horizons. In the short-term, supply-demand mismatch and supply chain disruption could provide upward pressure on the asset class, while rising oil prices might stymie consumers ability to spend on goods and services. In the medium-term, large increases in money supply used to finance government deficit spending could cause inflationary pressure to further increase commodity prices and in the long-term, government net-zero policies might result in higher carbon costs, which could raise soft commodity prices, as well as greatly increase demand for a new set of commodities integral to developing a clean energy complex.
  • Globalization has been driven by global demographic trends and trade policies since the 1980s that are slowly reversing due primarily to the working age population in China peaking last decade.
  • Labor market integration caused lower wage inflation which led to lower inflation globally. Central banks responded by progressively lowering interest rates, driving asset prices higher and causing balance sheets to expand rapidly relative to income.
  • Economic inequality across generations as voting demographics change in developed markets could lead to a redirection of capital and will influence the rate at which balance sheet issues are resolved.
  • Recent growth in sustainable and responsible investing strategies has been parabolic but encompasses a wide range of implementations. Limiting one’s investable universe through exclusion or negative screening reduces potential Sharpe ratios, while integrating material sustainability information as part of a holistic analysis of individual companies, countries, and commodities boosts them.
  • Given current government positioning, climate change mitigation and adaptation will likely be a key driver of secular trends for the coming decade. Large investments will be required to increase end-use efficiency and electrification of transportation and buildings, generate and transmit renewable energy, develop bioenergy and other carbon-free fuels, capture and store carbon dioxide, reduce emissions, and increase land sinks. Each of these verticals can shape the future path of equity, credit, and real asset prices if net-zero goals are to be met.

To arrive at these views, we have done extensive research that involves proprietary information and third-party data. If you are interested in a full copy of the report, please contact [email protected].

Special Report – US Elections: Part 3

To conclude this series of Special Reports examining the 2020 United States election, we want to take a closer look at one of President-Elect Biden’s cabinet picks, what the selection could mean for sustainability and fiscal policy, and developments at the Fed regarding climate change. Part 1 detailed our probabilistic approach to predicting a Biden win, while Part 2 dug into his policy platform, fiscal approach, and where we could see bipartisan support (hint: tech antitrust).

Election Outcome

As a quick refresher, let us first level-set on how things have shaken out since November 3. In a pattern many analysts suspected would occur, Republican voters turned out en masse for in-person voting on Election Day, giving President Trump and other Republicans early leads at the polls, but as mail-in votes were counted across the country, President-Elect Biden edged into the lead in a handful of key states and two runoffs were set for the Georgia senate races. President Trump contested the election results in many states, but elections were certified, and electoral votes cast by each of the battleground states in question (Georgia, Pennsylvania, Wisconsin, Michigan, and Arizona), guaranteeing a Biden presidency.

In Georgia, two hotly contested senate races determined the final composition of the Senate. At the caucus level, the final tally now shows 50 Republicans and 50 Democrats, with both Messrs. Warnock and Ossoff defeating Republican incumbents. We wrote in our final update to investors on October 27 that there was a 66.1% chance of a Blue Wave in D.C., including the scenario in which we have arrived. A surprise double Democrat win has given the incoming administration (with the vice-presidential tiebreaker) the ability to freely legislate. Caucus moderates, like Independent Angus King from Maine, and centrist Democrats from states with more practical, fiscally conservative electorates will be critically important to the passing of any legislation and are likely to serve as a dampening mechanism against some of the more extreme agenda items coming from the party’s fringes. However, we do expect this split to result in a streamlined nomination process for executive branch members and judges – expediting the rate at which we expect to see implementation of the President-Elect’s policy platform.

President-Elect Biden’s Cabinet

Partisan gridlock aside, the executive branch is expected to leverage its powers to advance its policy agenda, thus rendering the members of Cabinet ever more important. As is tradition in the Cabinet Room of the White House, the President and Vice President sit at the middle of a long table, opposite one another, with the members of Cabinet (e.g., department heads) organized around the table according to the date the department was established (and de facto, by importance). To the right of the President, and first ranking department head, sits the Secretary of State. And to the right of the Vice President sits the second ranking department head, the Secretary of Treasury.

Mrs. Janet Yellen, the nominee for Secretary of Treasury, needs no introduction. In her acceptance speech, the former Fed chair pointed to five issues as part of her agenda within the Biden administration: (1) inequality, (2) stagnant wages for non-college graduates, (3) communities that have lost industry with no new jobs to replace it, (4) racial disparities in pay, jobs, housing, food security, and small business lending, and (5) a gender disparity keeping women out of the workforce. While opinions differ on how to interpret the data to either support or refute those positions, one thing is clear, Janet Yellen, who as Fed Chairwoman said it was in fact “her job” to discuss economic inequality before Congress, will be attempting to address income inequality in America that may likely be as bad, if not worse, than it was after the Gilded Age preceding the Great Depression.

The Secretary of Treasury is the lead go-between for the executive branch and Congress on matters of fiscal policy and budgetary spending. Yellen can be described as a progressive Keynesian, believing that government intervention should be utilized as necessary to restore full employment and demand. She is a stated supporter of broader unemployment benefits and has been characterized in the media as “pro-labor.” As Fed Chair, her monetary policy toolset was limited to interest rate control and quantitative easing – as she navigated the post-crisis period, she maintained low interest rates, encouraging employment but consequently also causing asset price inflation which in many ways exacerbated the inequality issue.

Stepping into her new role, Mrs. Yellen will have a wholly different set of levers to pull. With a second wave of Covid-19 spreading and vaccine rollouts being less successful than forecast, there is a good chance that as part of the follow-on coronavirus relief package to come after Inauguration Day, we see her reinstate the expanded unemployment benefits that expired last summer. She has also come out in favor of fiscal support for state and local governments, a contested view on Capitol Hill. She recognizes these entities as important employers, and notes that if they are not helped, there will be large layoffs and more difficult to solve problems in the future. It is important to remember that state and local governments are required to maintain balanced budgets and cannot raise money selling treasury securities like the federal government, meaning in times of low revenue (e.g., low sales tax revenue, low metro ridership), states and municipalities are required to cut costs (e.g., jobs, subway service). Abroad, she will be central to negotiating America’s position in trade deals, and as a believer in globalization, will likely be a measured, stark contrast to the outgoing administration. Finally, she has stated a desire to leave the system more guarded – the New York Times characterized it as, “putting training wheels on capitalism.” An example is her support for budgetary stabilizers, which would kick in when the economy declined and do not require Congress to vote and pass a fiscal package but would automatically increase unemployment benefits.

Given her background, we expect the Federal Reserve Bank and executive branch to be far more in sync, and for Mrs. Yellen, who has gone on record discussing how recent asset inflation has not carried over to working people, to be instrumental in shaping the country’s fiscal agenda.

Federal Reserve Joins NGFS

Last month, the Federal Reserve officially joined the Network of Central Banks and Supervisors for Greening the Financial System, a collection of central banks meant to exchange ideas and best practices to account for environment and climate risk in the financial sector. The Fed has recently began paying more attention to climate change and can thank former Chair Yellen for being the first Chair to begin examining the impact of broader economic and global issues on the financial sector. In April 2019, Mark Carney, former Governor of Bank of England and Chair of the NGFS, penned an open letter detailing four recommendations from the coalition’s first report seeking to translate commitments into action: (1) integrate monitoring of climate-related financial risks into day-to-day supervisory work, financial stability monitoring, and board risk management, (2) integrate sustainability into central bank portfolio management, (3) collaborate to bridge the data gaps to enhance the assessment of climate-related risks, and (4) build in-house capacity and share knowledge with other stakeholders on management of climate related financial risks. For a myriad of reasons, particularly given our investment strategy, it is both exciting and encouraging that the Federal Reserve is participating in the organization.

Together at the Group of 30, Yellen and Carney wrote that governments should treat climate change and fighting global warming like monetary policy, because both require considerable long-term decisions that can be undermined by short-term partisan pressures. Carney is pushing for all listed companies to report on their exposure to climate risks for by 2023 and substantiated his reasoning in a recent talk at the Dallas Fed. As governor of the BoE, he oversaw the insurance industry and noted that those who oversee property and casualty insurance, in addition to reinsurance, are keenly focused on climate change. Over the past decade they are consistently repricing coverage because, “what was once the tail has become the central scenario in terms of extreme weather events.” He went further to echo a sentiment we share, that it was necessary for the BoE to get involved in climate change because it was prudent responsibility. Ultimately they recommended a change to capital ratios for banks based off who they lent to – banks would be required to maintain greater reserves for lending to brown industries versus green. While on the surface this may seem partisan, it is important to recognize the following – as society slowly starts to more seriously consider these issues, climate policy will be stricter and banks could end up with very large stranded assets. As such, Carney believes that banks need to be stress tested for vulnerabilities associated with climate change in the same way they are tested for exogenous shocks after the 2008 crisis.   


The United States still faces a myriad of threats: the Covid-19 pandemic, a sharp economic downturn, and attacks on its democratic institutions. In 1936, as Roosevelt accepted his party’s nomination in Philadelphia he said, “Governments can err, presidents do make mistakes, but the immortal Dante tells us that divine justice weighs the sins of the cold-blooded and the sins of the warm-hearted in different scales.” It is our belief that recent events have not created an irreversible rupture in the social fabric of this country, and its result will be one of compromise to the exclusion of extremists. Trump’s impeachment process could mark the start of a new era of bipartisan cooperation. Like Roosevelt, the new Democratic president has the opportunity to implement far-reaching reforms through a Green Bipartisan New-New-Deal that will reform the United States infrastructure, increase income distribution and maintain its strategic role in the world for decades to come. Combined with Janet Yellen’s penchant for fighting unemployment and inequality, and the Fed’s increasing posture on climate change, we think that 2021 can be a big year for sustainability and investments that incorporate such thinking. We hope you enjoyed your holiday season; our team is excited for what’s ahead and look forward to you reading our future commentaries.

Sincerely,

The Norbury Partners Team