
The flattening of interest rate curves is nothing new. In the US, swaps markets are pricing that in one year, the difference between the 2-year rate and the 10-year rate (the preferred reference for curve shape) will be -39bps, meaning the 2-year rate is 39bps higher than the 10-year. That compares to a difference of +140bps almost exactly one year ago, when the 10-year rate was materially higher than the 2-year.
Reasons abound, from the perception of more hawkish Fed policy given elevated inflation concerns, to lower pricing of terminal and neutral rate expectations as the Fed pulls forward the timing of the hikes.
What is more curious is how flat the very long end of the swap curve is right now in the US and Europe. In the United States, the difference between the 10-year rate and the 30-year rate sits at around -14bps, with the one-year forward at an eye-watering -21bps. In Europe, things are even more extreme, with the difference between the 10-year and 30-year rates at -17bps, and the one-year forward at -34bps. That part of the interest rates curve is not typically used to express a view on the path of interest rates like the 2y10ys, and assuming that the time-value of money is positive (something we’ll be hearing more about in this inflationary period), usually trades in positive territory with the 30-year rate above the 10-year rate.
Just how extreme the levels we are seeing now is the focus of this Macro Minute.
Let’s first look at the United States. In the past 30 years, the difference between 10-year and 30-year rates (10y30y for short) has been on average +40bps, staying most of the time within 1 standard deviation above or below the mean. As of today, the spread now sits 2 standard deviations below the mean. And how often does this rate differential stay at or below 2 standard deviations? Less than 0.2% of the time. In 30 years of data, the most consecutive days that it has ever stayed below that level is 5. Furthermore, in this period it has never touched 2.5 standard deviations below the mean (but it came incredibly close in 2008).
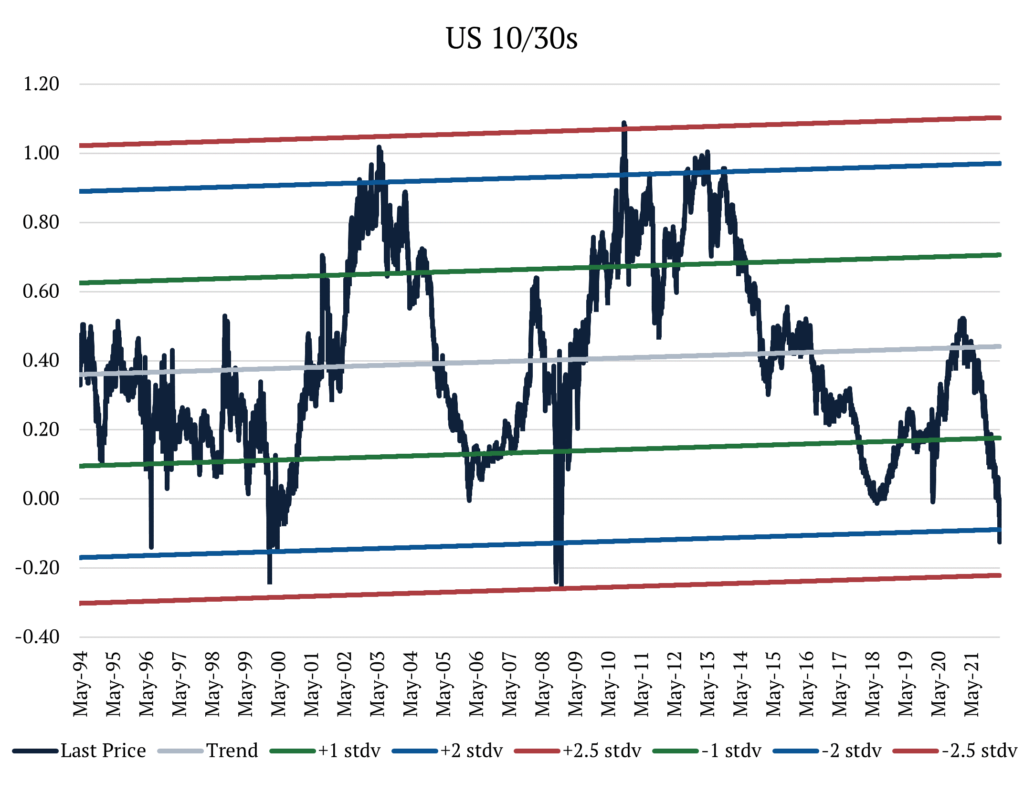
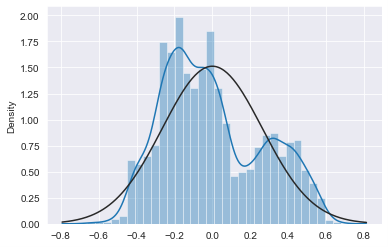
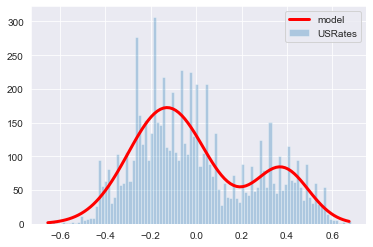
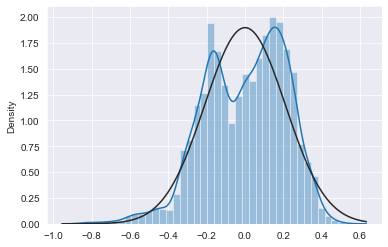
When plotting the divergence of the rates differential to its trend we can see how this data is distributed. From the charts below we see that the data fits the bimodal distribution better than the normal distribution. However, both distributions overestimate the tails when compared to the data, meaning we can assume that they will yield conservative estimates for the probabilities of very small or very large numbers. Using the probability density functions to estimate the probability of the 10y30 moving below current levels, we get a probability of 1.4% when using the normal distribution and 0.20% when using the bimodal.
When looking at Europe, we recognize that the 10y30y’s moves are more extreme than in the United States. For the past 30 years, the 10y30y has averaged +42bps. Like in the US, the spread most often lives between 1 standard deviation above or below the mean, but it spends more time below 2 standard deviations than in the US, at about 3% of the period. Today, we find ourselves sitting nearly 3 standard deviations below the mean. How often does this rate differential stay at or below 3 standard deviations? About 0.4% of the time. In 30 years of data, the greatest number of consecutive days it has ever stayed below that level was 12. Additionally in this period, it has only touched 4 standard deviations below the mean once in 2008, before retracing toward the mean on the following day.
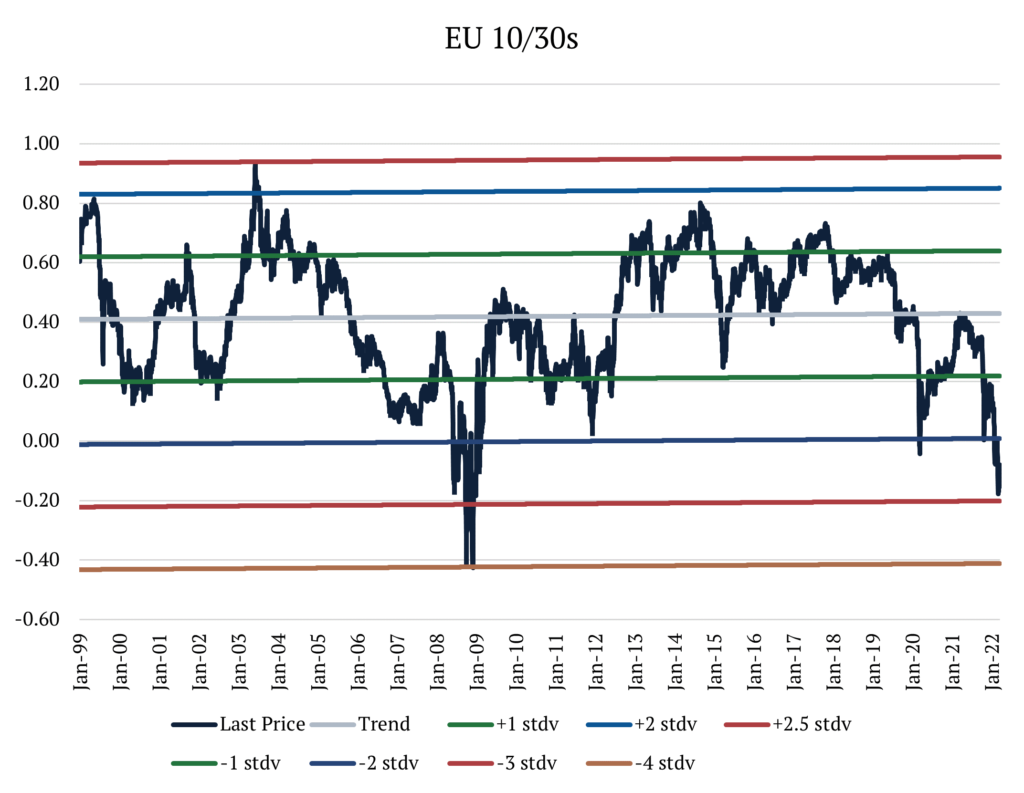
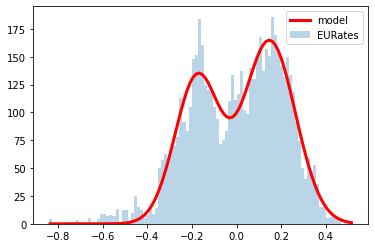
In Europe, we also find that the historical data better fits the bimodal distribution than the normal distribution. Here, the normal distribution underestimates the left-tail, while the bimodal distribution underestimates both tails, so we should take the results with a grain of salt. However, using probability density functions to estimate the probability of the 10y30ys moving below current levels, we get a probability of 0.23% by using the normal distribution and 0.24% from the bimodal.
We fundamentally believe that we are in a new normal of permanently higher inflation rates around the world (albeit less than today once supply chain disruptions ease) and with that, the return of higher term premiums. Combining that with the statistical analysis above makes us believe these markets are largely dislocated.