Macro Minute: We Learn From History That We Do Not Learn From History

Despite all the efforts of the most brilliant economists and analysts in the world to build models mimicking the methods of physics that follow their own self-contained logic, rules, and patterns to predict outcomes, when faced with failure, they dismiss it by claiming that “random shocks” had somehow disturbed equations and did not need to be explained since they are “nonrecurring aberrations.” War, pandemics, and politics are not abnormal historical events, only in economics.
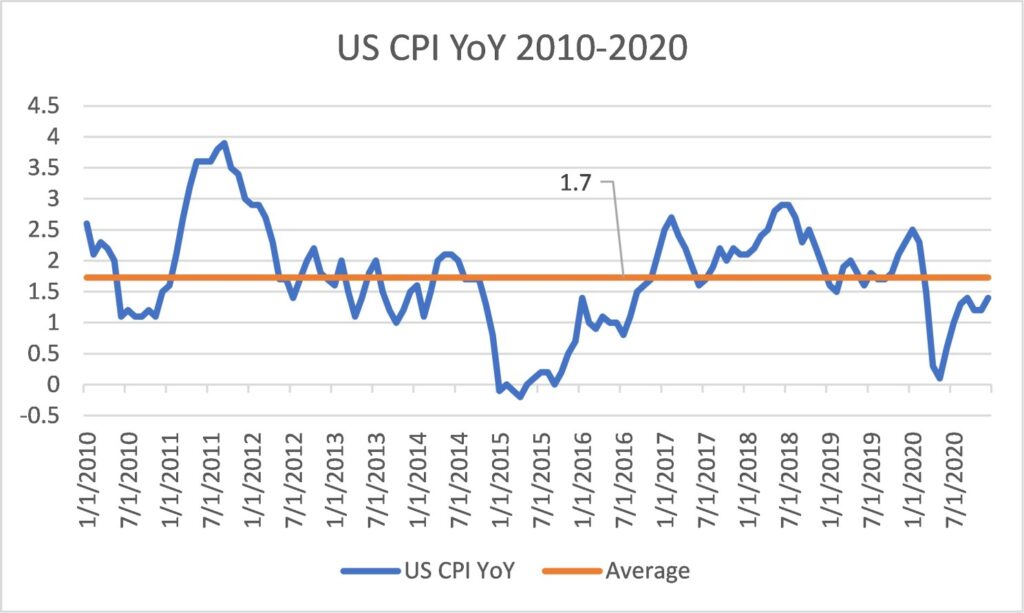
However, many questions in economics can be approached more simply through history. In the most recent record, from 2010 to 2020, US CPI YoY averaged only 1.7%, below the Fed’s target (how much did that play a role in the recent late response from the Central Bank is anyone’s guess). However, in the history of the US, there are only a handful of times that the inflation picture could be described as stable.
Looking back at American history, we find six inflationary spiral events. The first occurred in the late 1700s just after the Revolutionary War; the second in 1813 after the War of 1812; the third in the 1860s during the Civil War; the fourth in the late 1910s after World War I; the fifth around and after World War II in the mid-1940s; and, the most current one in the 1970s associated with the Vietnam War. These periods were always followed by long periods of deflation. Evidence would point to politics, not economics, to explain inflationary spirals, and war looks like the common denominator. War in itself has many different impacts on inflation (as we discussed in this Macro Minute: The Reflexivity of Inflation and Conflict). Still, it is really the increase in money spent by the government, above what it collects in taxes, that makes inflation and negative real rates an attractive solution to the debt problem.

Looking back to the latest inflationary cycles of the 1970s, we find a few similarities and one significant difference. [1]

Similar to the present day, in 1975, the government balance sheet resembled conditions only tolerated during periods of war. And in the preceding years, just like recently, conservative governments that were supposed to be fiscally conservative were actually accelerating the deficit. In today’s world, for example, if interest rates rise above inflation, the Treasury’s interest expense goes up as debt rolls over, and the Fed reduces remittances to the Treasury. The Congressional Budget Office calculates that a 1% increase in real rates increases the annual deficit by $250 billion, about 1% of GDP, planting the seeds for an explosive debt dynamic.

In the 1970s, oil price inflation was a big problem, increasing to around 6 percent per month. More recently, on average, oil has been growing at 4.2 percent per month since January 2021. That includes the price corrections we saw in the last couple of months. The contribution to the CPI is still high at 47% YoY at current gasoline prices.

In the 1970s, real interest rates reached -4 percent. Today, we are living through the most extended period of negative real rates, currently sitting at -6 percent. That is before factoring in what can happen with nominal rates in a recessionary scare. We calculate real rates by subtracting the US Treasury 10-year yield by the current CPI YoY number. We believe this is a better indicator of real rates on Main Street than the real rates derived from the TIPS markets on Wall Street. This is the rate that alters the lives and actions of people who are not traders or advisors and who do not follow the FOMC decisions or read the Wall Street Journal. Different from the previous cycle, when the Fed was focused on impacting asset prices, to have an impact on goods and services prices, the central bank needs to focus on the decisions in the real economy and not in financial markets. 

“At 15 percent inflation, an investor lending $1 million at 10 percent ‘loses’ $50,000 a year. You cannot count on the lender being a complete idiot, sooner or later, he will stop lending at low-interest rates and invest the money himself in commodities or real estate.” – Senator William Proxmire. October 1979

Another interesting observation from looking at real interest rates is that every recession is proceeded by positive real rates. More importantly, real rates tend to turn negative to help the economy once a downturn starts. This brings us to the recessionary debate. Like today, in 1979, most economists, including the Fed, were forecasting a recession. They had been wrong for many months, and in September, data showed the economy was not tipping over; it was accelerating again. This was true even with a deceleration in housing and autos and the fear of recession. “A Gallup survey found that 62 percent of the public expected a recession sometime in 1979.”

In an inflationary economy, people behave differently. Inflation doesn’t slow people down. With inflation at 16 percent, borrowing at lower rates seemed like a good deal. Bank credit was expanding at an annual rate of 20 percent. Most consumers did not care about what the higher interest rates were, as long as the monthly payments could fit their incomes. This is not a foreign concept for Latin Americans.

“Lenders were still surprised at how many families were willing to take on home mortgages at 13 percent or even higher. ‘ Perhaps it is not so hard to understand,’ Volcker said, ‘when you realize that the prices of houses have been going up at 15 percent or more.’” – 1979

Today, bank credit is growing at +12% for consumers and +8% for Commercial and Industrial clients. We’ve been following bank’s earnings calls very closely and we find that all the major banks see strong balance sheets, very low forward-looking default rates, and expect credit to grow in the mid-teens for the next few quarters. This past week, American Express reported that overall cardholder spending rose 30% from a year earlier.

Even when the Fed was finally able to create the presumed remedy, a prolonged recession that endured for 15 months with unemployment rising to 9.1 percent and industrial production shrinking to roughly 15 percent, as soon as the economy recovered, inflation came roaring back, rising even higher than before even with employment never getting close to its natural rate. With the supply of commodities constrained, even a short-term decrease in demand does not fix the inflation problem; it only postpones it to the following part of the cycle when policies revert to accommodative.

Lastly, the Fed genuinely did not know how much interest rates would have to rise to break inflation. If record levels of rates were not fixing the problem, how high would rates need to go to do it? Nor did it have the political capital to do what was necessary. Volcker acknowledges, ‘We could have just tightened, but I probably would have had trouble getting policy as much tighter as it needed to be. I could have lived with a more orthodox tightening, but I saw some value in just changing the parameters of the way we did things. (…) it would serve as a veil that cloaked the tough decisions.’”

“There is a wide concern about the Fed’s resolve in adhering to this policy in the face of an election year and the increasing likelihood of a recession. If strong words and actions are not followed by results, then holders of dollar-denominated financial assets in the US and abroad will conclude that the recent changes are no more significant than the statements and policy changes of prior years which did not reduce inflation. When rhetoric sufficed several years ago, tangible proof is now required of the Fed’s intentions.” – Federal Advisory Council 1979

The similarities are striking.

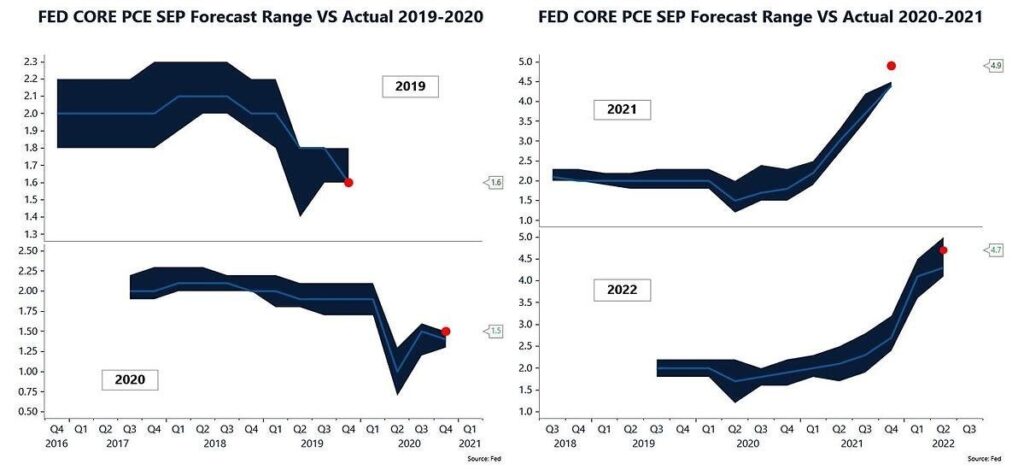
The main difference between the 1970s and today lies in the credibility that central banks around the world collected during a period of global deflationary forces that made them look like they could bend prices to their will and achieve their dual objective effortlessly, giving rise to the mantra “Don’t fight the Fed!” On July 14th, 2022, Governor Waller said, “The response of financial markets to the FOMC’s policy actions and communications indicate to me that the Committee retains the credibility and the public confidence that is needed to make monetary policy effective. (….) lenders and borrowers are still doing business at these rates, which indicates that they believe the FOMC’s policy intentions are credible, as broadly reflected in the interest rate paths in the Summary of Economic Projections (SEP).” Today, markets price the Fed’s projections to perfection.
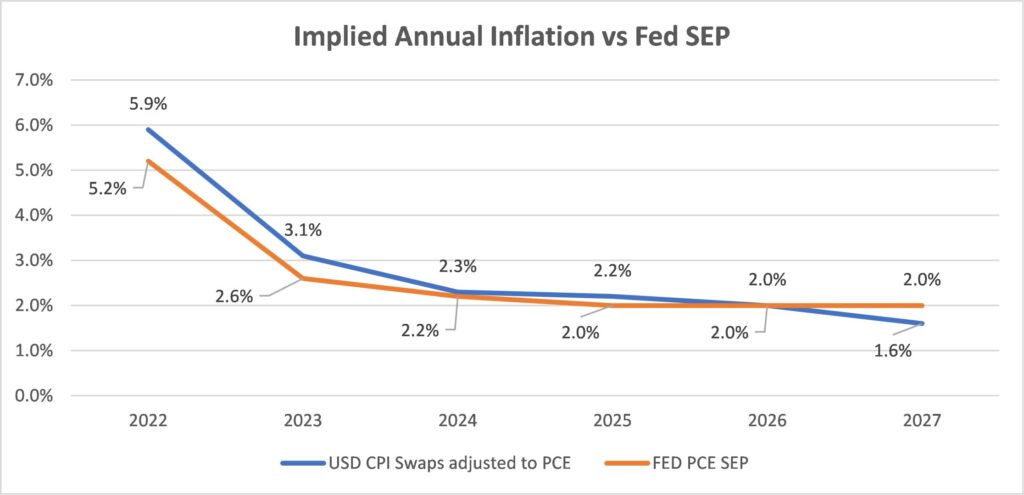
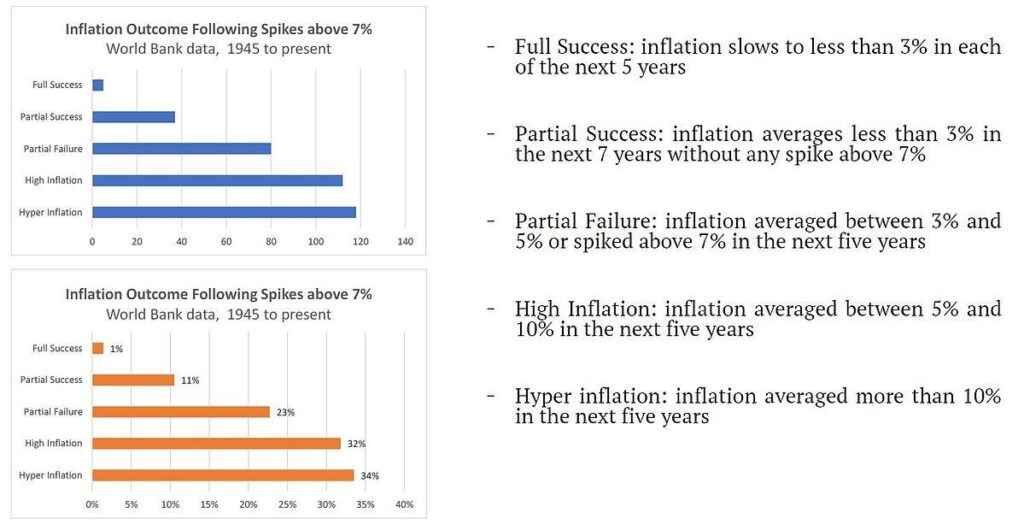
What does history tell us about that? StoneX’s Vincent Deluard shows us that using post-war data from the World Bank of more than 350 events when inflation spiked above 7%, only 1.4% of the time, inflation slows to less than 3% in each of the next five years. Markets are pricing 1 in 70 odds as if it were 100 percent certain.
“Acting hastily is essential to [a trader’s] profitability. If today’s quickest-to-the-keyboard move makes little sense according to some notion of ‘fundamentals,’ who cares? Overshooting is a feature, not a bug.” – Alan S. Blinder, July 2022.

“Traders must and do therefore respond literally instantly to all news to which they think other traders might respond. Whether the news is considered economically significant or even true is immaterial.” – Albert Wojnilower, Chief Economist at First Boston 1964-1986

This confidence also has an impact on the USD. With the expectation that inflation will converge to 2% in the next 18 months, interest rate differentials make the currency attractive. That, in turn, keeps inflation in the US in check. The DXY Dollar index is more than 17 percent up YoY, while the US CPI is 9.1 percent. Being conservative, we can assume a short-run currency passthrough in the US at about 25 percent.[2] This means that if the US Dollar was flat year-over-year, inflation should be a whopping +13%! This blind faith in central banks is what is keeping everything together. But history also tells us that after a long deflationary cycle and the build-up in credibility, what comes next is the drawing down of goodwill until there is nothing left.

“We’ve lost that euphoria that we had fifteen years ago, that we knew all the answers to managing the economy.” – Volcker 1989

[1] A good friend of the firm and fellow investor, knowing of our quest to understand history, pointed out to us that the team at MacroStrategy research was studying a book written in 1989 by William Greider called “The Secrets of the Temple” about the Fed’s fight against inflation under Volcker to help them with a similar pursuit. This book has been invaluable in our understanding of the period, and all quotes in this letter are from the book. https://www.amazon.com/Secrets-Temple-Federal-Reserve-Country/dp/0671675567/ 

[2] Campa, Jose Manuel, and Linda S. Goldberg. “Exchange rate pass-through into import prices.” Review of Economics and Statistics 87.4 (2005): 679-690. (https://www.nber.org/system/files/working_papers/w8934/w8934.pdf)

Exchange Rate Pass-Through and Monetary Policy, Governor Frederic S. Mishkin, at the Norges Bank Conference on Monetary Policy, Oslo, Norway. March 07, 2008 (https://www.federalreserve.gov/newsevents/speech/mishkin20080307a.htm)

Takhtamanova, Yelena F. “Understanding changes in exchange rate pass-through.” Journal of Macroeconomics 32.4 (2010): 1118-1130. (https://www.frbsf.org/economic-research/wp-content/uploads/sites/4/wp08-13bk.pdf) 

Special Report – US Elections: Part 2

If you haven’t had the opportunity to read Part 1 from this series of Special Reports on the United States election, you can find it here. As a refresher, we used a combination of historical and mathematical analysis to arrive at probabilities for a Biden-Harris win and a Blue Wave, defined as a Democrat-controlled House, Senate, and Oval Office. Below, we will begin with a quick update of our election forecasts before moving onto the prospective impact of said forecasts on fiscal policy. We will then more closely examine the high-level and near-term spending implications of former Vice President Biden’s policy agenda on industries and sectors before wrapping up with a look at how a bipartisan push for antitrust legislation might manifest.


Refreshing Probabilities: Senate Seats Matter
With two weeks left until Election Day, our current forecasts estimate a 91% chance of Mr. Biden winning the presidency and a 69.3% probability of a Blue Wave. Our Blue Wave probability includes all permutations of contested Senate races that would result in a 50-50 split or better for Democrats (given the Vice President holds the tiebreaking vote in the Senate). The probability of Democrats having at least 50 seats is 76%, which drops to 44% for 51 seats, 15% for 52, and quickly converges toward zero as we add more Democrats to the Senate. This is an important distinction to make before discussing fiscal policy because a 50- or 51-person majority will require a legislative agenda that satisfies moderate centrists for Democrats to carry the necessary votes. For this reason, we continue to closely monitor Senate races in states like Iowa and North Carolina that will ultimately decide the balance of power in the Senate, and thereby guide our views on impending fiscal policy and subsequently, our market outlook.


Under current rules, Congress can make changes to taxes and benefits programs with a simple 51-vote majority in the Senate through use of the budget reconciliation process. However, annual spending bills (appropriations) and the establishment of new programs require a filibuster-proof 60 votes to pass the Senate, as do changes to regulatory policy, antitrust law, immigration, and minimum wage. Elimination of the filibuster has been floated by both parties since the turn of the century and will be under consideration in the case of a marginal Blue Wave in order to expedite the passage of Democratic legislation, but is unlikely to be the first bill passed.


Although it would require bipartisan support to reach 60 votes, we view the passage of an infrastructure bill in the second half of next year after another virus relief package as the most probable leg of Blue Wave fiscal policy. Subsequently, we view a broad reconciliation bill covering changes to healthcare and tax increases as likely to follow, needing only 51 votes, but with a lower probability considering the support needed from moderate Democrats in a 50- or 51-Democrat Senate. The last and least probable pillar of Mr. Biden’s legislative agenda is education, which would need to pass with 60 votes and extends from pre-K to university, drawing on former candidate Senator Bernie Sanders’ bill for higher education.


Fiscal Policy for a Blue Wave
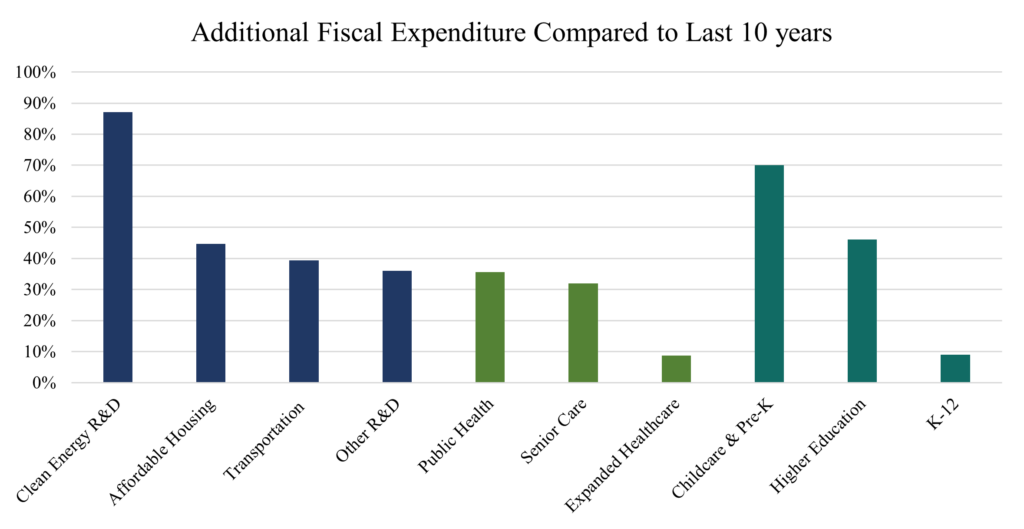
Notwithstanding a Covid-19 stimulus package, the Biden-Harris ticket has set forth an aggressive fiscal agenda with estimate gross spending between $9-10 trillion over the next ten years. They intend to offset approximately $5 trillion of this spending through tax increases, budget reappropriations and savings. Our analysis here is focused on gross additional spending over the next decade, how it compares to spending this past decade, and how much of the spending we estimate to occur during Mr. Biden’s first term.


We’ll begin with an examination of spending on infrastructure, research, and development. It is interesting to note that private investment in fixed assets (specifically residential and non-residential buildings, industrial equipment, and transportation equipment) was just over six times that of government investment in infrastructure (mostly transportation) from 2010 to 2019 – in other words, every $1 committed to government infrastructure investment resulted in $6 of investment from the private sector. At this point, it remains unclear if Democrats’ infrastructure and R&D policies will crowd out the private sector, or if they will be additive and result in private sector expansion. Former Vice President Biden’s Build Back Better infrastructure plan contains $2 trillion in funds earmarked mainly for transportation and clean energy infrastructure, but also includes $300 billion for research & development, $300 billion for housing construction, and $100 billion for education-related construction. In aggregate, the Congressional Budget Office estimates the net increase in infrastructure spending will amount closer to $450 billion over 10 years, but expect a Democratic Congress to at the very least pass legislation that boosts infrastructure spending by a few hundred billion over the next 5 years, including tax incentives for renewable energy.


Government investment in non-defense energy, natural resources, environment, and general science research and development totaled $172.6 billion from 2010 to 2020 – this plan pledges an additional $150 billion, or an 87% increase over the next decade, to clean energy research and development. Mr. Biden’ plan also commits $750 billion to affordable housing through expansion of Section 8 and a tax-credit for first-time homebuyers. Last year’s data shows that 33% of homes were purchased by first-time buyers and 4% of United States households are on some type of federal housing assistance. Using this as an approximate basis for private sector spending in these areas, this amounts to a 44.7% increase in spending on first-time homeownership and affordable housing over last decade. Assuming half of the $2 trillion is invested in transportation projects over the next ten years, Mr. Biden’s plan will have committed an additional 39.4% of total investment by state, local, and federal governments this decade. Finally, he has pledged another $150 billion to healthcare, infrastructure, and telecom research and development, which amounts to about 36% of healthcare and transportation R&D in the past decade. Research spending is the most frontloaded of his agenda, with approximately 30% expected to occur within his first term.


Moving on to healthcare, where total spending in the next decade is expected to be approximately $2.8 trillion, not including expanded social security or supplemental security income. Mr. Biden’s healthcare plan includes $300 billion for rural health, mental health, and to aid the opioid crisis. In practice, this means doubling federal funding for Community Health Centers, increasing payments to rural facilities, and expanded funding for mental health services. When compared to aggregate spend on public health activity since 2010, this sums to a 35.5% increase for the next decade. Support for the elderly and those in need of long-term care is expected to increase by $600 billion, an estimated 32% of total public and private spending on senior and elderly living care from 2010 to 2020. The final leg of his plan intends to build on former President Obama’s Affordable Care Act by expanding subsidies and enrolling low-income families in premium-free coverage. The estimate cost of expanded health insurance coverage for Americans is $1.9 trillion, which is only 8.7% of the staggering $21.9 trillion that has been spent on private health insurance, Medicare, and Medicaid in America since 2010. Altogether only about 21% of this spending is expected to occur during the Biden-Harris first term.


Ending with education, where our estimates show aggregate spending in excess of $2.5 trillion over the next decade. Mr. Biden’s plan includes access to free pre-K for all children aged 3-4 through a mixed delivery system combining public schools and private care centers. Additionally, he plans to make the existing tax credit for child and dependent care fully refundable and expand it to cover half of all expenses for one or more children, capped at $8,000 and $16,000 respectively. Biden’s agenda for the Childcare Support & pre-K program is $325 billion over the next decade – which would add 70% to aggregate investment in childcare and pre-K as compared to the previous decade. The largest of the educational spending programs is for higher education, where estimated spending, including free tuition to public universities and colleges for families below $125,000 in income, is $1.6 trillion. This amount of stimulus is equal to 46% of total expenditures by public higher education institutions since 2010 and will grow given the desire to legislate future forgiveness of student loans. In other words, a Blue Wave would result in the federal government covering nearly half of all tuition paid at public higher education institutions in the past decade! Conversely, the additional funding apportioned to support K-12 education in inner cities and for disabled students is a big headline number, $600 billion, but would only represent an increase of about 9% of total public school spending compared to the last 10 years. In total, about 28% of this spending is expected to occur in Mr. Biden’s first term using a 2022 start-date for the education stimulus due to legislative timing.

Former Vice President Biden has laid out an extensive fiscal policy agenda that will be most affected by the Senate results November. We have looked closely at his policies and identified a few key sectors to follow as we begin to position for a Blue Wave: clean energy, homebuilders, industrials, and healthcare.


Implications of Bipartisanship on Anti-Trust

In addition to aggressive fiscal policy, a Democratic White House and Congress might seek substantial changes to antitrust law and, in the process, re-order the mergers and acquisition market for a very long time.


Even with markets slowed by Covid-19, North American M&A activity reached $226.8 billion over 2,205 transactions in Q2 2020 alone. The United States has developed a robust and well understood body of antitrust law to regulate the M&A market and prevent, or at least impede, anticompetitive market concentration of power and the rise of monopolies. This issue has gotten very real attention from the House of Representatives in connection with their investigation concerning whether giant US tech companies have acquired and exercised anticompetitive power in digital and online marketplaces. On October 6, the House Judiciary Committee concluded a 16-month investigation asserting that these large tech companies have very much done so and that there is a “clear and compelling need to strengthen antitrust enforcement.”


The report carries with it the potential, if the recommendations are adopted, to restructure the M&A marketplace as it flips presumptions that have been in place in antitrust law since Standard Oil was broken up as a monopoly in 1911 after the U.S. Government sued it for violations of the Sherman Act. The presumption, under the report, is that companies wishing to merge will have to prove that their mergers or acquisitions are not anticompetitive instead of it being the responsibility of the Government to prove that the mergers or acquisitions are anticompetitive; this is a significant shift. A consequence from this is that we may see many more creative and innovative forms intended to defeat or impede government review – for example, joint ventures where there is no formal combination but in which form the result could still be the same – concentration of market power but now without formal antitrust review.


The Committee also proposes to block all acquisitions of potential rivals and nascent competitors. It suggests that such activity be considered presumptively anticompetitive and thus prohibited. This might have the unanticipated consequence of, in the tech space, deterring startups and innovation as founders lose a natural exit. In the pharmaceutical space, where much of the R&D for truly innovative products is outsourced to startups who are then later acquired, this could have the effect of depriving the world of significant medical treatment research and advancement as drug companies can no longer buy potential competitive bio-tech research firms with interesting advances.


All things considered, the report is a clarion call to Congress to take a leadership role in antitrust policy formulation and enforcement. This would represent a major change in the entire market as professionals who have previously guided antitrust policy and enforcement are replaced by those who are instead governed by a two-year fundraising and election cycle. This is coupled with a significant call to re-invigorate private antitrust enforcement by undoing or eliminating significant amounts of precedent and jurisprudence related to antitrust actions, including lowering the standards by which a court should even evaluate a pleading. This will, if taken up, result in a massive amount of private litigation risk that every merger or acquisition will now have to expect and plan for. It remains to be seen whether the current M&A insurance market or the policies that insurance companies have written for directors and officers will cover the private litigation risks that might be a natural consequence of some of the changes presented in the face of a Blue Wave.


Currently, antitrust law has bipartisan support, and as laid out by the House committee, presents meaningful future risks to the technology sector and could result in systemic market disruption after the election. We are closely following both parties’ rhetoric and the evolution of the House Committee and Supreme Court’s views into and past Election Day as we measure current and future US market risk.


As always, we will continue to monitor markets, polls, and macro data to update our views. We appreciate you taking the time to read part 2 of our series on US Elections. If you have any questions, please don’t hesitate to get in touch with one of us.

Sincerely,

The Norbury Partners Team