Macro Minute: What If?

The consensus today is that the global economy, led by developed countries, is heading into recession in the next few quarters. The debate ranges between hard or soft landing. Bloomberg’s recession probability forecast stands at 65% today. To add to this bleak outlook, we have Fannie Mae and Visa, companies with real economy visibility, forecasting an 85% chance of recession. 

Some of this doom and gloom is based on the past relationship between surveys and hard data. Soft data points to the worst economic environment in half a century, only comparable to the Great Financial Crisis.

Financial markets are also forecasting an imminent recession when looking at the shape of the yield curve. The spread between 2-year and 10-year US Treasuries is the lowest since the high inflation period of the 1970s.

If we could point to only one data point to explain such dreary levels of survey responses and market pricing, it would be the speed and magnitude of the change in short-term nominal rates. The Federal Reserve hiked 425 basis points in nine months. This represents the fastest and largest rate-hiking cycle since the 1970s. The market and economists alike are saying that the current level of interest rates is incompatible with the economy’s structure. Markets believe that this level of rates will invariably cause the economy to contract, inflation to go back to 2% in the short- and long-term, and the Fed to start cutting rates in the second half of 2023.

The conclusion is valid if we accept the assumption that the trends of the 1985-2019 decades are still in effect, and that what we have seen over the past two years was just the effect of transitory impacts of Covid measures. 

Having said that, markets are already broadly pricing these assumptions with a reasonably high confidence level. As investors, we must ask ourselves, ‘what if?’ What if there is a deeper reason for the past two years’ economic dynamics? What if we are not living through (only) transitory effects? Then, looking at nominal rates to predict a recession and a turning point for inflation would be misguided. And if so, the US treasury market would have to reprice materially in 2023, causing a structural shift in the global economy and financial markets.

Inflation in the period from 1985 to 2019 averaged 2.6%. This is when we saw the third wave of globalization, increased working-age population, plentiful fossil fuel energy, and the unquestioned Pax Americana. With inflation at such low levels, one would be excused if all its conclusions were based on nominal rates assumptions. But inflation is only low sometimes. From 1950 to 1985, as well as from 2019 to today, inflation averaged 4.5%. When inflation is higher, nominal measures become less important and it is essential to look at real interest rates. Here, we use the Fed Funds Rate deflated by YoY CPI.

Real interest rates tell a very different story. We have seen a sharp increase in real rates since the beginning of 2022, but that move started from a historically low level. Today, real rates are still extremely negative, even after 425 basis points of hikes from the Fed in 2022. The conclusions we draw from looking at this measure are very different from those based on the nominal rate. We see a monetary stance that is not restrictive and, therefore, supportive of growth. With that, we also see the probability of recession at very low levels in the next few quarters, and little reason for the Fed to start cutting rates in the second half of 2023 (let alone the 125 basis points of cuts the market is pricing in between 2H23 and 2H24 – see graph below). This measure helps explain why the labor market is so strong, something that keeps confounding central bankers and analysts alike. It also helps explain why surveys are so pessimistic. In periods of inflation, people tend to have a very pessimistic view of the economy, even when real growth is positive. 

We must then ask ourselves. What if real rates are more important for the economy than nominal rates? What if the structural trends of less globalization, a decrease in the working-age population, scarce fossil fuel energy, and a multipolar world materially increase R*? What if the recent weakness in inflation numbers is just a transitory effect as part of a long-term structural inflationary period? What if growth surprises to the upside in 2023, even with the Fed keeping rates above 5%? What if?

Catalysts into Year-End

We’ve spent most of the summer discussing macroeconomic trends and data (from inflation to employment) that could change the course of policy and markets, so today we want to focus on a handful of catalysts between now and the end of the year that could have meaningful consequences for asset prices.

China 20th Party Congress

The 20th Party Congress begins on October 16, amid economic turmoil in the country largely driven by the property crisis and Zero-Covid policies.

What’s at stake?

It is widely believed that President Xi Jiping is aiming for a third consecutive (and likely life-long) term as President, bucking the trend of two-term limits established by law in the 1990s then reversed by constitutional amendment in 2018. On the real estate front, China has already begun to implement measures to provide relief to the troubled market and its developers by implementing a $29 billion loan program to help developers finish halted projects, relaxing home purchase restrictions, and lowering the mortgage rate for first-time homeowners in cities where selling prices continued to fall over the summer. With power consolidated post-Congress and a focus on Common Prosperity, we believe there is a chance of greater central government intervention in the market to assuage resident’s concerns about the sector and restart growth given the Chinese real estate market accounts for roughly 25% of the economy.

On September 30, Xi and other members of leadership attended National Day celebrations without wearing masks at one of their last public appearances before the Congress. This, along with Chinese MRNA vaccines being rolled out in Indonesia, could point to shift in Zero-Covid policies on the other side of the meeting. The last patient entered the 28-day EUA test for efficacy against current strains on August 29, and results are expected this month. With EUA approval of one or a handful of the 14 drugs that went to trial in November, we could see a full reopening of the country by April next year given the available vaccine manufacturing capacity.

What’s it means for markets?

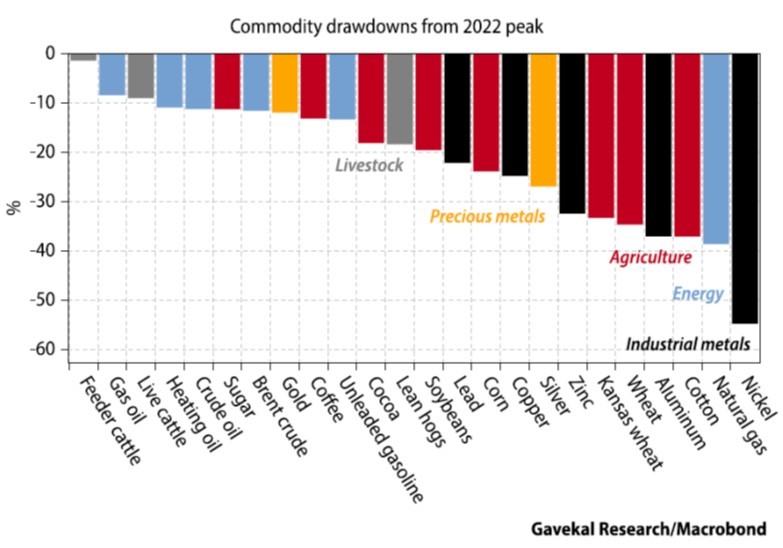
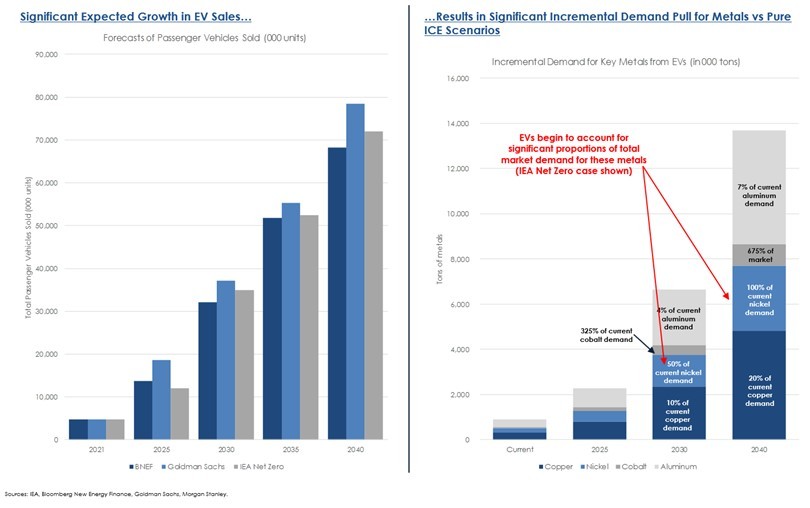
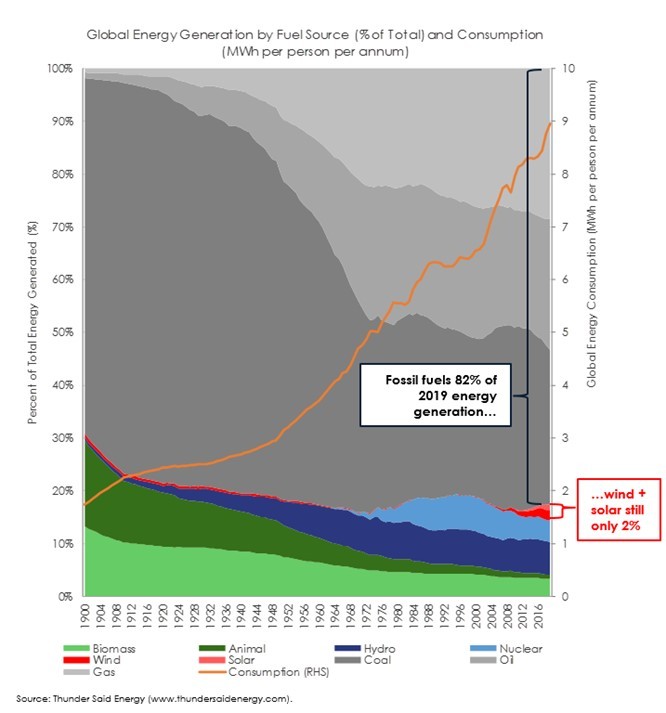
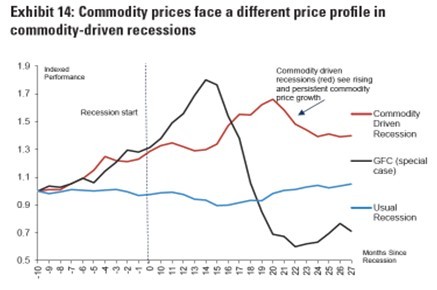
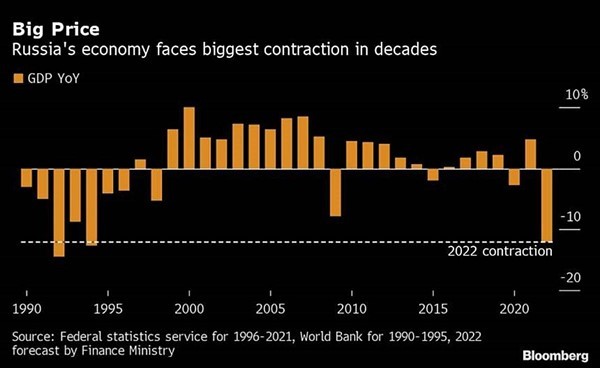
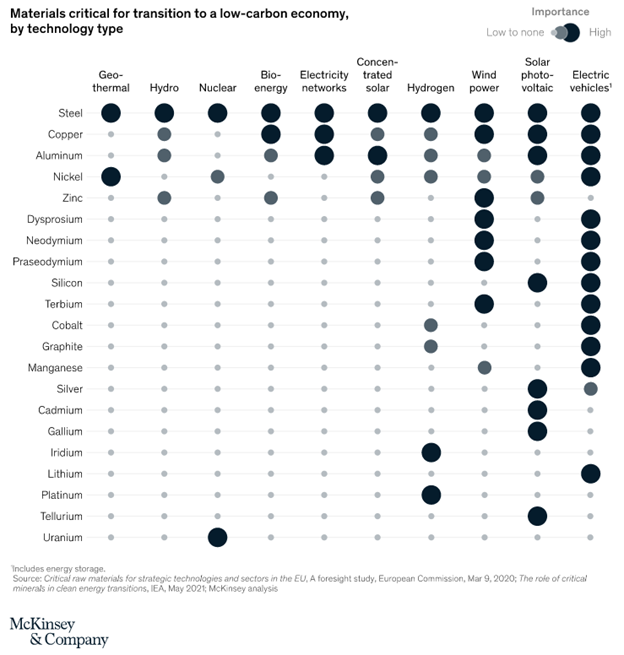
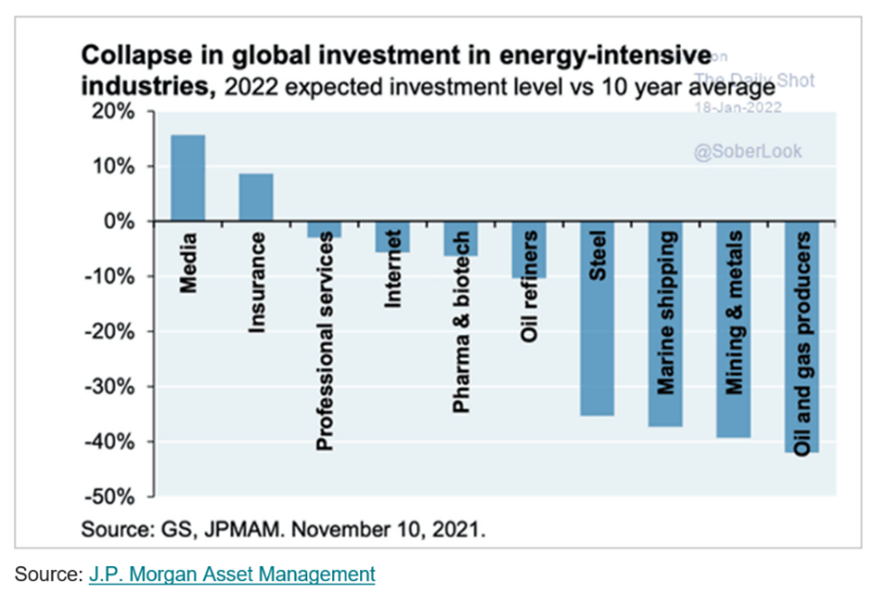
China is one of the largest consumers of commodities in the world. A reprieve on the property front would put a floor under building materials like steel, copper, and aluminum. A reversal of Zero-Covid rules and the reopening of the country would boost goods consumption, improve mobility, thereby increasing energy consumption, and increase non-residential fixed asset investment in sectors like renewable infrastructure. Altogether, these changes would represent a material change to the demand-side of many commodities from oil to cobalt, and re-rate prices in the sector higher.  

Russia-Ukraine Escalation

This week, President Putin signed the decree approving the annexation of four Ukrainian regions (Donetsk, Luhansk, Zaporizhzhia, and Kherson), amounting to approximately 15% of the country’s area. Escalation in defense of “Russian territory” is a more significant risk than the market is pricing for the coming weeks and months as Ukraine continues its counter-offensive and other catalysts roll off the calendar. (Recall that Putin waited for the completion of the Beijing Winter Olympics to begin his “Special Military Operation.”)

What’s at stake?

Putin has ordered the Russian nationalization of Ukraine’s largest nuclear plant in Zaporizhzhia this week, and reports of Russian missiles hitting civilian and military targets in the region hit the newswire on Wednesday. Mounting counter-offensives from Ukraine across the territories could lead to further escalation by Russia. In the interest of defending land in the Russian Federation, the country’s articles of war or principles for engagement may allow for the use of more significant weapons against Ukrainian troops in the annexed areas.

NATO reported this week that Russia may be planning a major nuclear test near their border with Ukraine in the Black Sea, which the Kremlin has denied, but many news outlets reported the movement of nuclear weapon equipment by train toward Ukraine. We believe that the probability of a smaller tactical nuke being used in Ukraine, which has reportedly led to Kyiv distributing Potassium Iodide to its citizens, is being mispriced or at the very least, underappreciated in the market. Remember that the last nuclear test in the world occurred by the United States in 1992, and while the USSR conducted a test in 1990, the post-breakup Russian Federation has never performed one.

What it means for markets?

Significant geopolitical risk often begets a flight to safety – namely the US dollar and Treasuries – away from equities. Specific to this case, any nuclear attack by Russia would cripple relations between Russia and the West (and possibly the entire globe), resulting in less energy and metals making it out of the country, limiting supply, which would further weigh on economic output across the world, particularly in Europe.

Brazil Presidential Elections

In the first round of elections, former President Lula da Silva received 48.4% of the votes, in line with polls, while current President Jair Bolsonaro secured 43.2% of the vote, roughly 5% above polling numbers. The run-off election is scheduled for October 30.

What’s at stake?

Pro-Bolsonaro and right-leaning candidates did well in congressional races, gaining 22 seats in the House and guaranteeing his PL party would be the largest in both the House and Senate. Overall, the bi-cameral congress became less fragmented, but more polarized, which could make for a more oppositional congress in the event of a Lula win. We believe this result increases the probability of fiscal responsibility, regardless the result of the presidential race.

What it means for markets?

Given the increased probability of fiscal responsibility from both sides, we believe that once election risk passes and the final result is accepted by both the parties and general public, risk assets in the country should do well in the coming months.

US Midterms

Amid poor presidential approval ratings, United States midterms elections are slated to take place November 8 as a quasi-referendum on Biden’s presidency.

What’s at stake?

In the House, all 435 seats are up for re-election as they are every two years. FiveThirtyEight currently estimates that Republicans have a 70% chance of winning a majority in the House of Representatives, shifting control from Democrats and Speaker of the House, Nancy Pelosi.

In the Senate, 34 seats are on the ballot this year, with 15 currently held by Republicans, 13 by Democrats, and six seats open after senators announced they would not be seeking re-election. The current split of 50-50 slightly tilts to the Democrats, with Vice President Kamala Harris serving as the tie-breaking vote, and FiveThirtyEight currently gives Democrats a 2-in-3 chance of holding the senate, with an average number of 51 seats.

A split Congress often leads to gridlock, meaning Democrats would look to maximize use of the post-election lame duck period to push an expansive agenda while they still controlled both chambers.

What it means for markets?

Wharton professor Jeremy Siegel noted to CNBC that markets tend to perform well when there is political “gridlock”. Since 1944, the S&P has averaged a 13% annual return in calendar years with a Democrat president and split Congress. More immediately this fall, the debt ceiling debate, the potential for more fiscal spending toward monkeypox and hurricane aid among other things, and the possibility of more SPR releases to dampen inflation effects for a voter-base most energized by the economy have the potential to impact Treasury markets and oil markets, with a derivative impact on equity prices. Finally, while the Fed maintains an apolitical stance, a deluge of inflationary fiscal measures could influence its interest rate path, which could weigh on all asset classes.

OPEC+ Meeting & Further SPR Releases

After announcing 2mbpd cuts to quotas on Wednesday, which will amount to roughly 900k bpd of less production by OPEC+ members after accounting for missed quotas, the cartel announced that the current production agreement would be extended to the end of 2023 and that they would be meeting every two months in lieu of the current pace of monthly meetings. In response, the White House said that Biden would continue SPR releases as appropriate, with reports of another 10 million barrels being released in November to combat rising gas prices, again.

What’s at stake?

The Strategic Petroleum Reserve (SPR) is at its lowest levels since 1984, with the population of the United States approximately 45% higher, and the Biden administration has leased the fewest number of federal acres for energy production through 19 months in office since Harry Truman in 1945-46, when offshore drilling was new and the federal government didn’t control deep-water leases that make up the largest part of the federal oil-and-gas program today. OPEC+, citing a potential global slowdown and less directly, a dissatisfaction with the price of oil, opted to decrease production as the US has either intentionally or unintentionally massaged prices lower through oil releases. Most of the actual production cuts will come from Saudi Arabia, and interestingly enough, Business Insider reported on Thursday that the kingdom had lowered oil prices for Europe but raised them for the United States. The administration appears to be gambling that SPR releases will help their prospects in the midterm elections, while at the same time playing chicken with OPEC+ on production, decreasing the country’s ability to manage in the event of any positive oil demand shock.

What it means for markets?

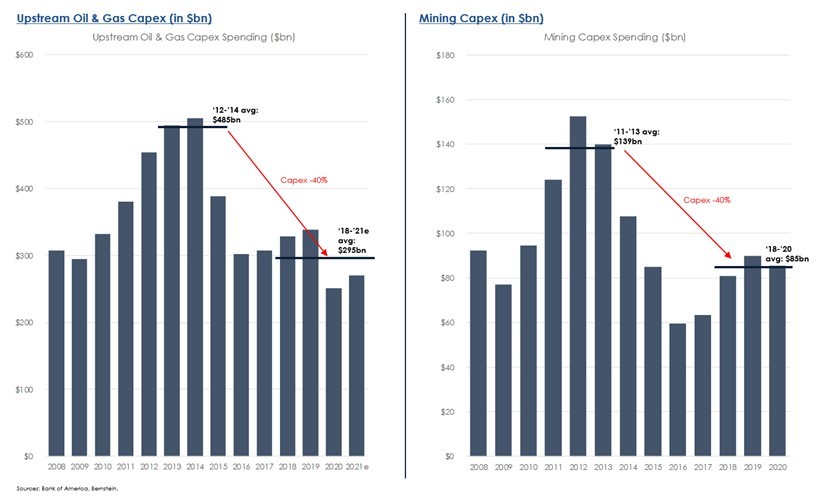
With interest rates marching higher increasing the cost of capital and the green lobby in DC targeting oil and gas companies, domestic producers have not been quick to bring more wells back online. Any rebound in Chinese demand, or a ban on domestic exports, could result in a significant increase in the price of energy at a time when domestic production is lacking and disincentivized from growing. Energy prices are a natural pass-through to virtually everything, raising the floor on commodity prices and potentially re-accelerating inflation which could possibly lead to more hawkish monetary policy in the US. Such a move would not only weigh on equity prices, but also be a tailwind to the US dollar in the event that other central banks have less latitude to tighten. Further tightening by other central banks, namely the ECB, could push those countries deeper into recession and further weigh on both global growth and markets.

Macro Minute: Dollar dollar bill, y’all

This past Friday, September 9th, Bill Dudley was on air early morning making the case that the Fed wants a strong dollar. We know very well why the Fed needs a strong dollar. We wrote on July 25th about the relationship between inflation expectations and the currency’s strength:

“The DXY Dollar index is more than 17 percent up YoY, while the US CPI is 9.1 percent. Being conservative, we can assume a short-run currency passthrough in the US at about 25 percent. This means that if the US Dollar was flat year-over-year, inflation should be a whopping +13%! This blind faith in central banks is what is keeping everything together.”  – Macro Minute: We Learn From History That We Do Not Learn From History. July 25th, 2022.

However, how long the Fed can enjoy this position is less clear. Free-floating exchange rates, as opposed to the traditional view that expects a move to equilibrium at fair value, are inherently unstable. The reason for that is the reflexive nature of exchange rates. A change in exchange rates affects inflation, interest rates, economic activity, and other fundamental factors that then have an impact on exchange rates. This effect creates self-reinforcing and self-defeating processes that are very pronounced in currency markets.

In the case of the US dollar today, the fundamentals and nonspeculative transactions point in the direction of depreciation. It is only when looking at speculative transactions that we can find an explanation for the strength of the dollar in the past 12 months. In reality, the classification of speculative and nonspeculative is much more subtle, but for the purposes of this analysis, a simplified version of the model should suffice.

Non-speculative capital flows arise from the need (not the choice) to buy or sell dollars. On this account, all the fundamentals point towards the depreciation of the US dollar. The need to finance the US twin deficits is not new, but it has increased meaningfully recently. But one component in particular is seeing the largest changes- the need for USD in commercial transactions. Charles Gave, co-founder of Gavekal, wrote an excellent piece on “Network Effects and De-globalization.” In it, he proposes that reserve currencies benefit from the network effect, and that the turning point for the demand for US dollar transactions happened when the US insisted upon oversight of all US dollar transactions anywhere in the world. He argues that the catalyst for accelerating the contraction of this network was the US sanctioning Russian assets earlier this year. This decline has so far been masked by an increase in demand for USD coming from the energy crisis in Europe. We agree with that analysis and we can see the relationship between natural gas prices in Europe and the EURUSD (inverted axis) pre and post-mid-2021 below.

Speculative capital, on the other hand, is attracted by rising exchange rates and rising interest rates. Of the two, exchange rates are by far the most important. It does not take very large movements in exchange rates to render the total return negative. In other words, speculative capital is motivated by expectations of the exchange rate, a reflexive process. And when markets are dominated by speculative flows, they are purely reflexive. This is a very unstable situation. The self-reinforcing process tends to become vulnerable the longer it lasts, and it is bound to reverse itself, setting in motion a process in the opposite direction.

This is an obviously oversimplified model, but it brings useful conclusions. When the inflow of speculative positions cannot keep pace with the trade deficit, rising interest obligations, and lower demand for trade in US dollars, the trend will reverse. When that happens, the reversal may accelerate into freefall, as the volume of speculative positions is poised to move against the dollar not only on the current flow, but also on the accumulated stock of speculative capital. Lastly, when that happens, the exchange rate will have an impact on fundamentals (inflation and inflation expectations) which in turn will have an impact on exchange rate expectations in a self-reinforcing process. All of this will make the Fed’s job that much harder.

Given the unpredictable nature of speculative flows and self-reinforcing trends, we can’t say for certain when this will happen, but if pressed for an answer, I would say in the next 9 months. If the US dollar maintains or accelerates its trend during this period, the EUR would have to be trading below 0.86, the JPY above 170, and GBP below parity. And if it doesn’t, the reversal would be dramatic, if not catastrophic.

Macro Minute: The Ides of June

When looking at the return of assets for the first half of the year, we find that US bonds posted their worst first half-year performance for over 100 years, while the S&P 500 declined 20.6% year-to-date, recording the worst first half of the year since 1970 and its 4th worst start on record. More broadly, the MSCI All Country World was down 20.9% for the period. Institutional investors are having one of their worst performance periods on record with the trusted 60/40 portfolio declining by 17% YTD, making it the second-worst start since the 1900s.

The month of June was marked by a sharp repricing of recession fears along with a VaR shock that led to risk reduction and high correlation across markets, providing very few opportunities for hedges and diversification. During the month, 10-year treasuries increased +16bps, with the difference between the 10 and 30-year bonds flattening by 3bps. The 2-year bond yield increased by almost +40bps for the month and jumped +54bps in two trading sessions, the largest move since 2008 when it moved +55bps. The S&P and Nasdaq were down -8.4% and -8.7%, while Energy and Materials sold off -18% and -15%, respectively. Commodities were down across the board, ranging from -10% to -40% in agriculture commodities, and -22% to -57% in industrial metals. In other words, you could not make money in June by being long.

Looking at the long-term we believe that commodity and commodity-related equities exposed to the green energy transition have an exceptional demand backdrop that arises from decarbonization initiatives that will only increase going forward while also possessing major supply challenges. As an example, the average EV consumes five to six times more copper than a combustion engine vehicle. Conservative estimates of EV production put copper demand, just from this source, increasing 20-25% over the next two decades. This does not even account for the increasing demand for copper arising from other electrification needs like batteries and cables.

This is happening against the backdrop of virtually no production increases and very low inventory levels. Mining companies learned from their mistakes in the previous CAPEX cycle of the early 2000s, and along with the more recent price declines and volatility, board members will not be in a rush to invest in capacity. Rather, they will prefer dividends and share buybacks. 

On a March 1st podcast interview with Eric Mandelblatt, he says “(…) three of the largest copper mines in the world were developed over 100 years ago. There’s been only one of the 10 largest copper mines in the world that’s been developed this century since (2001). So, you have this situation where supply in the near term is highly inelastic.”

Reflecting on the recent commodities drawdown, we put too much weight on the probability that markets would realize early that the Fed won’t be able to run the level of positive real yields required to bring down inflation to its target. Rather, when looking at prices, it appears markets are pricing the Fed outlook to perfection. We are now accounting for that and expecting that the crucible moment will occur after the Fed reaches their expectation of terminal rate, or just above, and inflation is still above target. At that moment, the Fed will either have to prove credible, or the market should then realize that the Fed will let inflation run above target for longer. It is worth pointing out that history is not on the Fed’s side. Vicent Deluard from StoneX shows that, historically, central banks only manage to bring inflation down to 3% in each of the next 5 years, following a spike above 7%, in less than 1.4% of the time. What we see today is a market that blindly believes in the Fed and prices that 1.4% probability scenario with full certainty, while completely dismissing the other scenarios. 

Also, we did not expect the market to aggressively price in a deflationary bust scenario so rapidly after a higher-than-expected inflation print and still extremely negative real rates. We expected that during this secular bull market in commodities, we would see some ups and downs in prices, but the speed and magnitude of these moves only compare to 2008, which was a massively deflationary bust period. We assign a very small probability of that scenario (for a detailed analysis on this, please see our recently published annual report), and we believe that if a recession is around the corner, it would be an inflationary bust instead. 

With the supply of commodities constrained, even a short-term decrease in demand would not fix the problem of inflation, it would only postpone it to the following part of the cycle when policies revert to accommodative to shore up demand. We know from history that during inflationary busts, commodities have two-thirds of their upward move after a recession begins. 

2022 Annual Report

We believe that 2021 marked the beginning of a secular bull market in commodities and commodity-related equities, with the usual peaks and troughs along the way. A decade of underinvestment by producers and refiners of natural resources coupled with burgeoning excess demand for those resources driven by a myriad of global initiatives including electrification, food security, and energy independence has shifted the long-term supply-demand outlook into deficit for many commodities.

Going back to the 1970s, a period where many investors are looking for clues given the recent run-up in inflation globally, commodity prices and related equities enjoyed a bull market that only ended in 1980 with the collapse of a commodity bubble. In the early 1980s, oil prices began to drop, and at the same time the Federal Reserve was credibly moving to “break the back of inflation”. Since then, we lived through a constant cycle of disinflationary forces that ended in the mid-2010s.

Almost all crises since the 1980s were balance sheet crises, and therefore deflationary. The Japan bust, the Asian crisis, the sub-prime crash, and the Euro crisis were all balance sheet and banking crises. Those crises were deeply deflationary in an already deflationary environment. As balance sheets were negatively impacted, borrowers constrained consumption and investment to pay down debt, while at the same time banks constrained lending, which in turn negatively impacted the price of assets used to collateralize said debt, restricting banks’ ability to lend in a never-ending vicious cycle… until governments stepped in.

Global demographics served as a tailwind for labor and led to an increase in savings that got recycled into US Treasuries – colloquially known as the global savings glut. With the fall of the Berlin Wall in 1990 and China being admitted to the WTO in 2001, globalization went into overdrive as companies could tap into a global labor force, resulting in even more disinflation.

Equities and commodities have swapped market leadership in cycles averaging 18 years in length for over a century. Over time these cycles have become shorter with technological advancements, but they are still fairly consistent, predictable, and long. Commodity price bubbles tend to bust after military or economic conflicts due to the well-known “peace dividend” which drives lower commodity and input costs, better profit margins, higher equity multiples, and more leverage brought on by lower rates and a low-inflation environment. Conversely, when equity bubbles deflate, inflation resurges. Large amounts of debt that were accumulated during the expansionary phase must be reduced using a combination of inflation and defaults. When that happens, easy monetary policy follows, and military or economic conflict once again occurs, perpetuating the long-term cycle.

In the subsequent sections of this report, we examine in detail three probabilistic scenarios for what the medium- to long-term outlook in markets may be, but a summary of the analysis is as follows.

(1) Sustained growth and higher prices via re-leveraging of consumers, a renewed corporate investment cycle, and the build-up of inventories in a more inelastic supply environment. This view is anchored in the belief that the world is transitioning from slack to generally tight commodities supply. (P = 55%)

(2) Rising conflict, disruptions, and nonlinear upside price movements leading to a prolonged period of stagflation. Major wars (or other exogenous shocks like pandemics) produce high inflation, and even minor wars can interrupt trade. Conflict and inflation are intrinsically linked, especially coming out of a period of extreme money supply growth. (P = 35%)

(3) Continued price disinflation or deflation, western-dominated status quo, resumption of the technology capital expenditure boom, and prolonged strength for US equity index returns. In this scenario, the belief is that the Fed will not be as aggressive in hiking rates this cycle given the unsustainable divergence between rising debt as a percentage of US GDP and the falling nominal GDP growth derived from that debt. (P = 10%)

The above scenario analysis and applied probabilities shape our forward-looking market views and positioning. Throughout this report, we provide the economic data and analysis in support of these ideas, and a summation of the key points can be found below:

  • We believe that for at least the next few years, we are entering a new environment for inflation with consistently higher price levels. Some indicators to watch for are surging real estate prices, high money supply growth, large fiscal deficits, strong commodity prices, increasing geopolitical instability, and stretched valuations for the US dollar.
  • In that period, we also expect strong nominal GDP growth, while the outlook for real GDP growth is more uncertain given the rising risk of conflict or a central bank miscalculation.
  • Rising inflation will lead to Fed rate hikes, but the governors may have little choice but to return to an accommodative stance due to the “hangover” of past financial excesses and, potentially, war. Government roll-over rate risk is very large, with approximately two-thirds of United States federal debt maturing in the next four years.
  • We expect strong global commodity demand and commodity prices to be a central theme as well. Poor profits have discouraged investment by commodity producers since the mid-2000s, and the growth of sustainability concerns has exasperated the underinvestment.
  • With supply already in short store, producers have moved from the last decade of short duration investment – restock, destock, capex binge, balance sheet distress, capital raise, boom, and bust – to longer duration, disciplined capex cycles.
  • As a result of these dynamics, we expect commodities to outpace the S&P 500 over the next few years. Commodities become a defensive asset in commodity-driven recessions.
  • We see single-digit compound returns for the S&P over the period. The first part of the period will see negative returns and the later part low positive returns, as the focus shifts from multiple compression and falling earnings to cheaper valuations. Free cash flow generation will be key in both phases.
  • Inflation could be made significantly worse if increasing geopolitical instability leads to wars.

Given this outlook, we have built positions across the commodity complex, the core ones being in industrial metals – namely copper, aluminium, and cobalt – emission allowances, and grains. Alongside those positions, we have further built upon the theme through equity allocations to global energy refiners investing in renewable fuels (e.g., sustainable aviation fuel, renewable diesel), miners and refiners of industrial metals who lead in low carbon intensity production, and industrial companies exposed to the renewable revolution with large market share and pricing power. We expect the supply-demand fundamentals facing commodity markets to persist for many years, pressuring prices and having a negative impact on prevailing market sentiment, with a particular emphasis on long-duration assets. We will be hedging a portion of our equities exposure by betting against indices we find to be richly valued given our probability-weighted scenarios. We expect interest rates, especially in the developed world, to make higher highs and higher lows over the next few years, a quasi-mirror image of the lower highs and lower lows of the deflationary past few decades. Lastly, we believe that the currencies of commodity-exporting nations will benefit greatly from this scenario.

To arrive at these views, we have done extensive research that involves proprietary information and third-party data. If you are interested in a full copy of the report, please contact [email protected].

Macro Minute: The Russian Gambit

Last week, the European Union announced plans to ban Russian crude oil over the next six months and refined fuels by the end of the year as part of the sixth round of sanctions. Over the weekend, the proposed ban on its vessels transporting Russian oil to third-party countries was dropped, but the EU will retain a plan to prohibit insuring those shipments. Bloomberg reports that about 95% of the world’s tanker liability cover is arranged through a London-based organization that must heed European law. Without such insurance, Russia and its customers would have to find alternatives for risks, including oil spills and mishaps at sea, that can quickly run into multi-billion-dollar claims. (For more on the commodity trading business and how insurance impacts commodity flows, listen to “Javier Blas Explains How Commodity Trading Shops Really Work” on the Odd Lots Podcast).

The pain to European consumers is clear. The region last year got 27% of its oil imports and approximately 40% of gas from Russia (paying $104 billion for supplies of fossil fuels). Economists estimate a full embargo on Russian oil and gas reduces the area activity from 4% (Barclays) to 2% (Bundesbank), while some analysts have argued that the impact would be lower than that. Germany’s vice-chancellor Robert Habeck said his nation has already cut its reliance enough to make at least a full oil embargo manageable with the share of Russian crude in German imports falling to about 12% since the invasion.

For Russia, an oil embargo would limit the inflow of foreign currency and make difficult spending cuts necessary. Russia’s Finance Ministry expects its GDP to shrink as much as 12% this year, on par with the turmoil seen in the early 1990s, when the Soviet Union ultimately dissolved. On Monday, Russia said it expects its oil production to rise in May, and that it is seeing new buyers for its crude, including in Asia. But how much of this is true and how much of it is just posturing?

Changing oil shipping routes from Europe to Asia is not as trivial as Russia would lead us to believe. Different vessels are required to efficiently transport oil on different sea routes. When done properly, transport of crude oil by tankers is second only to pipelines in terms of efficiency, with the average cost of transport at $0.02 to $0.03 per gallon. When transporting oil, there are three main types of vessels: Very Large Crude Carriers / Ultra Large Crude Carriers, Suezmax, and Aframax vessels. There are about 800 VLCCs/ULCCs in the world used for long-haul routes and they carry around 2 million barrels each. There are about 700 Suezmax vessels capable of passing through the Suez Canal in a laden condition, and they can carry around 1 million barrels on long-haul routes. Lastly, there are about 600 Aframax carriers in the world, known as “go-fast boats,” moving about 600,000 barrels on short-haul routes.

Zoltan Pozsar of Credit Suisse estimates that roughly 1.3 million barrels of oil get shipped from Primorsk and Ust Luga to Europe on Aframax carriers and these journeys take a week or two to complete. Russia does not have pipelines to Asia so the only way to sell its product to new buyers is by using sea routes. However, it is uneconomical to transport crude on long-haul voyages on Aframax carriers and they would need more VLCCs/ULCCs to make that happen. Because Russian ports are not deep enough to dock VLCCs/ULCCs, they would first need to use Aframax vessels to get to a port to then transfer the crude to larger vessels. This transfer itself can takes weeks. After the transfer, the larger vessel would then take about 70 days to get to Asia, unload, and take a similar amount of time to return. This compares with just a couple of weeks when shipping to Europe. This would cause a sharp slowdown in Russia’s economic activity. The world would also need an extra 80 VLCCs/ULCCs to accommodate that change which represents 10% of the current global capacity of those vessels. Additionally, this only accounts for the re-routing of one product, oil, but Russia exports every major commodity.

The increasing competition for selling oil in Asia would have an impact on one of the Middle East’s biggest consumers. It is then no surprise that Saudi Arabia cut oil prices for Asia buyers over the weekend. This will not make Russia’s situation any easier. China benefits when Russia becomes weaker and more isolated and hence more dependent on Chinese goodwill. Let’s not forget that during Russia’s invasion of Crimea in 2014, China got Russia to agree to build (and possibly pay for) a dedicated pipeline at lower prices than it sells to Germany, even when the cost of gas from the new field is higher.

The cost of banning Russian oil might be large for Europe, but it can be even larger for Russia. This should increase the impact of sanctions and diminish the possibility of a unilateral cut in supply in the near future. 

Macro Minute: A Phoenix From the Ashes

While we normally use this section to discuss macroeconomic concepts that help frame our top-down asset allocation views, or to present bottom-up macro asset analysis, today we are highlighting a company that stands out in a world of higher commodity prices.

At present, there is much discussion on how legacy companies, particularly in the commodity space, must change how they do business to adapt to a sustainability-focused world. There is currently a plethora of negative attention on fossil fuel companies as CEOs go before Congress, but today we’re focused on a company that is seven years removed from an activist campaign and fresh off an upgrade from high yield to investment grade last December.

Alcoa is the fifth largest aluminum “pure player” globally, and the largest upstream producer in the Western world. Its operations are geographically diverse, with an integrated aluminum production business from bauxite and alumina procurement and processing, to smelting.

Aluminum is a critical input to virtually every aspect of the forthcoming renewable energy complex and is often referred to as solid electricity given the sheer amount of power (and carbon intensity) required to process the metal.

By our estimates, global aluminum balances are expected to persist in deficit for at least the next 2-3 years, which is already being reflected on exchanges; LME aluminum inventories are running 40% below their five-year average. 

75% of Alcoa’s smelting capacity is powered by renewable energy, which positions the company as one of the least emitting players in a highly energy-intensive sector.

Alcoa is naturally leveraged to aluminum prices and has been consistently delivering on cash flow generation due to a disciplined capital allocation strategy focused on rationalizing its asset base and deleveraging. The company has also been quick to target green growth initiatives with an emphasis on low-carbon aluminum products, helping to differentiate the company from its peers. Some analysts believe that one such peer, Rusal, is expected to see aluminum production go to zero in 2022 due to Russian sanctions precluding the import of bauxite and alumina, which should have a positive impact on Alcoa’s market share.

In our view, Alcoa is a good example of a legacy company from an old-fashioned industry that has increasingly gained investor interest, not only due to the quality of the company’s management but also from a positive industry backdrop (e.g., green transition, supply imbalance).

Macro Minute: Commodities in 2022

After a strong year, we believe 2022 is shaping up to be another good year for commodities. The theme across most sectors in the asset class is consistent – a fundamental mismatch between supply and demand is driving prices higher. Prices are being further pressured by increasing costs of capital for some (e.g., energy producers), higher input costs for others (e.g., fertilizer for agricultural products), and/or after a decade of underinvestment, a lack of new projects ready to boost supply (e.g., base metals mines). Any weakness in a historically strong USD will further the dollar-denominated sector’s move higher.

Looking across the asset class, one finds inventories of many commodities well below their 5-year averages entering 2022.

Concurrently, JP Morgan projects global investment in commodity sectors to be the lowest across all sectors this year. This comes at a time where the forces of ESG have driven costs of capital higher, leading major producers of commodities to hold off on investing until higher prices are sustained for a longer period.

Fundamentally, physical assets are driven by volumetric levels rather than expectations, which fuel financial assets. When supply cannot meet demand, and inventories cannot bridge that gap, only the highest bidders get access to a specific commodity. This process is called “demand destruction” and can produce parabolic price movements.

This past year, we saw an example of “demand destruction” price action in European natural gas (TTF). Weather seasonality impacted a very inelastic demand while shifting energy priorities related to net-zero goals, and regional geopolitics caused a shift on the supply side.

We expect to see more demand destruction across the commodities complex in 2022.

Macro Minute: Cross-Asset Views for 2022

Rather than provide a classic “Here are 10 things to watch” list that will more than likely be stale by the time you hear from us next, we’ll share quick views across different markets for 2022.

Equities

At a $3 trillion market cap, Apple is worth more than two years of Brazilian GDP or about equal to the United Kingdom’s GDP in 2020. Put simply, equities (particularly in the US) screen expensive by almost any metric. There are still opportunities to be had here, especially in companies levered to commodities, but with rates rising and Fed QT on the horizon, we are cautious on the asset class.

Commodities

The 2022 Norbury Partners Annual Report will be focused on commodities and a regime shift from an equity-driven market to one driven by commodities, but in brief, we think that decades of underinvestment across the complex, coupled with an increase in demand ex-China will be a boon for commodity prices. Commodities are essential to human life in a way incomparable to other financial assets. There is a strong case to be made that the sector will be a key piece of the geopolitical framework this decade (e.g., Russia, Kazakhstan, China).

Rates

We continue to monitor US interest rates with the view that they should persist moving higher from here and that the curve should steepen. While less clear on the number or pace of rate hikes this year, this paper from the Kansas City Fed (published October 2021) sheds some insight into how the Fed is thinking about policy normalization this time around.

Fewer hikes coupled with a bigger unwind of the balance sheet would in theory not only steepen the yield curve, but also allow banks (who borrow at the short-end and lend at the long-end) to continue making loans to maintain growth in the economy. A steepening yield curve would also help to cap the sharp rise in housing prices we’ve seen in the past year, a key goal for those looking to address wealth and asset inequality in the system.

Currencies

FX volatility screens as the cheapest among all asset classes, and we have been using this to hedge some of our high conviction positions in Equities and Rates.

Divestment Is Not The Answer: An Easy Way Out Of A Complex Problem

Divestment, the act of removing and or excluding particular sectors or segments of the market from investment portfolios, was all the rage at the beginning of the last decade in the face of climate change. Based on my perspective, however, the results of such action by institutions and portfolio managers have been uninspiring.

For citizens of a democracy, voting is the most important action one can take toward shaping the future path of economic and social policy in his or her municipalities, states and nations. George Nathan, an American editor in the early- to mid-1900s, has been credited with saying, “Bad officials are elected by good citizens who do not vote.”

A case can be made that the same level of responsibility held by voters in a democracy sits with the market when it comes to shaping a company’s business decisions. Shareholders, irrespective of size, are typically entitled “to vote in elections for the board of directors and on proposed operational alterations such as shifts of corporate aims and goals or fundamental structural changes,” according to Investopedia. When you consider the democratic tradition of voting to make a change, particularly in American culture, it is hard to “square the circle” when it comes to supporting divestment.

However, recently, the trend seems to be shifting. This year, shortly before Memorial Day, the board at Exxon “conceded defeat” to impact investment firm Engine No. 1, which drummed up (and won) a proxy fight by alleging the company was being disingenuous with its emissions targets and not taking its impact on climate change seriously enough. Through a combination of publicity and engaging with large shareholders, the newly launched firm used activism to, against the recommendation of Exxon’s executives, elect three candidates to the company’s board who are committed to pushing the company’s business model away from fossil fuels and toward renewable energy.

As an investor, one should strive to understand as many of the components of risk that will impact a company’s (or country’s) future rate of growth and ability to operate efficiently. We founded Norbury Partners, a sustainable macro fund, on the premise that it is impossible to make informed investment decisions without considering changing consumer preferences, as well as changes in the regulatory and policy environment arising from climate change mitigation and adaptation and access to basic services. However broad, certain sustainability information can be material to better understand macroeconomic variables and the idiosyncratic risks associated with countries and the future cash flows of corporations.

From severe flooding in low-lying cities caused by mega-storms to drought-stricken commodity harvests, and everything in between, it has become increasingly clear that fundamental data found on company 10-Ks, or in periodic sovereign data, does not always wholly paint a picture of the future. Like people and their voting habits, companies and countries change with the times. Look at the past six months: the United States rejoined the Paris Climate Agreement and the largest economies in the world committed to net-zero targets within the next 40 years.

Rather than divest, rational investors seeking to maximize their returns should look for companies in the early or interim stages of change that will create outsized value in a changing world energy paradigm. Often by the time companies mature, becoming renowned for their sustainability practices and stalwarts in environmental, social and corporate governance (ESG)-focused portfolios, the excess value created when a company managed its downsides and built upside has already been priced into the stock.

Furthermore, what industry is going to see a more significant shift in the changing world paradigm? Someone will have to provide the innovation and energy required to power a growing, more technology-centric world. By participating in a company that has long been called for divestment, Engine No. 1 has demonstrated that investors have a better chance of shaping the future and capturing upside for themselves as active shareholders than they do as spectators in the market.

Finally, the nature of markets guarantees that by divesting, particularly on a large scale, prices will be pushed down with more sellers than buyers. This, in turn, increases the expected return for divested company shares where business will continue as usual, bringing non-ESG-focused investors into the fold who are less likely to make the required changes (or vote along those lines) for a sustainable future.

By last fall, more than 1,200 institutional investors, with more than $14 trillion in assets, had made commitments to the divestment of fossil fuel holdings. Yet, the way I see it, the movement has failed to bring about the change it has been lauded to produce.

As citizens of a democracy, it is our right and our duty to exercise our vote in order to institute change. As investors, we should be looking for the upside to be found in energy companies transitioning to technologies more suitable for the future that policymakers have committed to. And as students of markets, we must recognize that by divesting shares and pushing prices down, we increase a stock’s expected return, thereby inviting marginal investors less committed to ESG and a sustainable future as shareholders, and creating a feedback loop of “more of the same,” with little prospects of advancing toward our goal.

Voting should not be something we talk about every four years. Utilize your ability to be an active market participant to drive the change you want to see.

Article also submitted to Forbes