We believe that 2021 marked the beginning of a secular bull market in commodities and commodity-related equities, with the usual peaks and troughs along the way. A decade of underinvestment by producers and refiners of natural resources coupled with burgeoning excess demand for those resources driven by a myriad of global initiatives including electrification, food security, and energy independence has shifted the long-term supply-demand outlook into deficit for many commodities.
Going back to the 1970s, a period where many investors are looking for clues given the recent run-up in inflation globally, commodity prices and related equities enjoyed a bull market that only ended in 1980 with the collapse of a commodity bubble. In the early 1980s, oil prices began to drop, and at the same time the Federal Reserve was credibly moving to “break the back of inflation”. Since then, we lived through a constant cycle of disinflationary forces that ended in the mid-2010s.
Almost all crises since the 1980s were balance sheet crises, and therefore deflationary. The Japan bust, the Asian crisis, the sub-prime crash, and the Euro crisis were all balance sheet and banking crises. Those crises were deeply deflationary in an already deflationary environment. As balance sheets were negatively impacted, borrowers constrained consumption and investment to pay down debt, while at the same time banks constrained lending, which in turn negatively impacted the price of assets used to collateralize said debt, restricting banks’ ability to lend in a never-ending vicious cycle… until governments stepped in.
Global demographics served as a tailwind for labor and led to an increase in savings that got recycled into US Treasuries – colloquially known as the global savings glut. With the fall of the Berlin Wall in 1990 and China being admitted to the WTO in 2001, globalization went into overdrive as companies could tap into a global labor force, resulting in even more disinflation.
Equities and commodities have swapped market leadership in cycles averaging 18 years in length for over a century. Over time these cycles have become shorter with technological advancements, but they are still fairly consistent, predictable, and long. Commodity price bubbles tend to bust after military or economic conflicts due to the well-known “peace dividend” which drives lower commodity and input costs, better profit margins, higher equity multiples, and more leverage brought on by lower rates and a low-inflation environment. Conversely, when equity bubbles deflate, inflation resurges. Large amounts of debt that were accumulated during the expansionary phase must be reduced using a combination of inflation and defaults. When that happens, easy monetary policy follows, and military or economic conflict once again occurs, perpetuating the long-term cycle.
In the subsequent sections of this report, we examine in detail three probabilistic scenarios for what the medium- to long-term outlook in markets may be, but a summary of the analysis is as follows.
(1) Sustained growth and higher prices via re-leveraging of consumers, a renewed corporate investment cycle, and the build-up of inventories in a more inelastic supply environment. This view is anchored in the belief that the world is transitioning from slack to generally tight commodities supply. (P = 55%)
(2) Rising conflict, disruptions, and nonlinear upside price movements leading to a prolonged period of stagflation. Major wars (or other exogenous shocks like pandemics) produce high inflation, and even minor wars can interrupt trade. Conflict and inflation are intrinsically linked, especially coming out of a period of extreme money supply growth. (P = 35%)
(3) Continued price disinflation or deflation, western-dominated status quo, resumption of the technology capital expenditure boom, and prolonged strength for US equity index returns. In this scenario, the belief is that the Fed will not be as aggressive in hiking rates this cycle given the unsustainable divergence between rising debt as a percentage of US GDP and the falling nominal GDP growth derived from that debt. (P = 10%)
The above scenario analysis and applied probabilities shape our forward-looking market views and positioning. Throughout this report, we provide the economic data and analysis in support of these ideas, and a summation of the key points can be found below:
We believe that for at least the next few years, we are entering a new environment for inflation with consistently higher price levels. Some indicators to watch for are surging real estate prices, high money supply growth, large fiscal deficits, strong commodity prices, increasing geopolitical instability, and stretched valuations for the US dollar.
In that period, we also expect strong nominal GDP growth, while the outlook for real GDP growth is more uncertain given the rising risk of conflict or a central bank miscalculation.
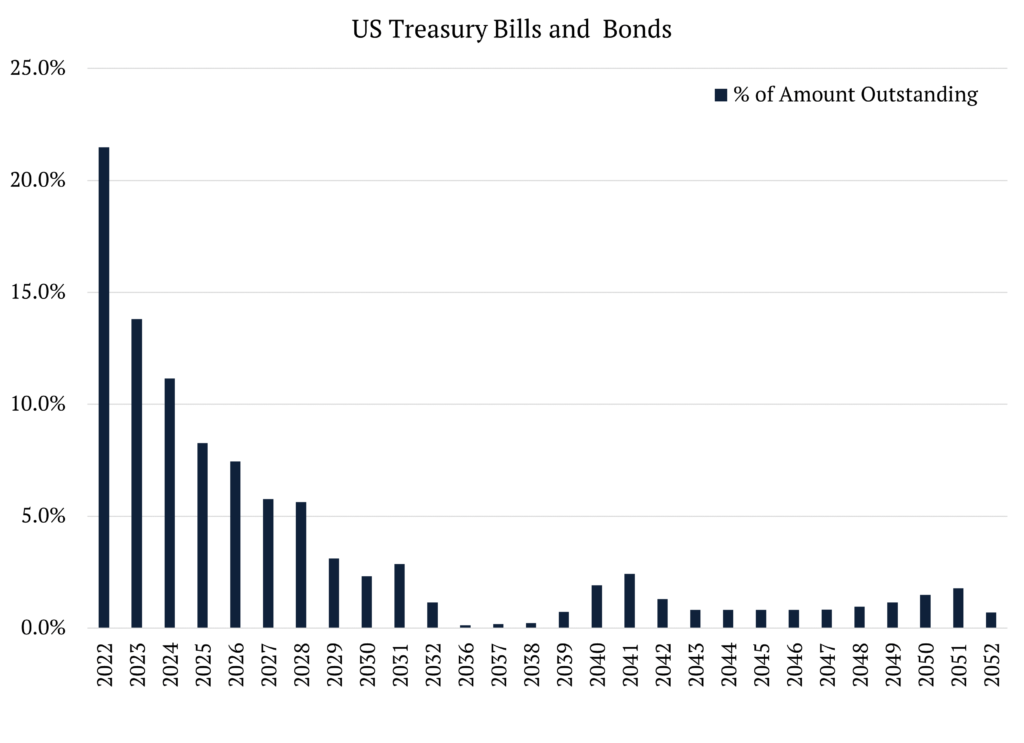
Rising inflation will lead to Fed rate hikes, but the governors may have little choice but to return to an accommodative stance due to the “hangover” of past financial excesses and, potentially, war. Government roll-over rate risk is very large, with approximately two-thirds of United States federal debt maturing in the next four years.
We expect strong global commodity demand and commodity prices to be a central theme as well. Poor profits have discouraged investment by commodity producers since the mid-2000s, and the growth of sustainability concerns has exasperated the underinvestment.
With supply already in short store, producers have moved from the last decade of short duration investment – restock, destock, capex binge, balance sheet distress, capital raise, boom, and bust – to longer duration, disciplined capex cycles.
As a result of these dynamics, we expect commodities to outpace the S&P 500 over the next few years. Commodities become a defensive asset in commodity-driven recessions.
We see single-digit compound returns for the S&P over the period. The first part of the period will see negative returns and the later part low positive returns, as the focus shifts from multiple compression and falling earnings to cheaper valuations. Free cash flow generation will be key in both phases.
Inflation could be made significantly worse if increasing geopolitical instability leads to wars.
Given this outlook, we have built positions across the commodity complex, the core ones being in industrial metals – namely copper, aluminium, and cobalt – emission allowances, and grains. Alongside those positions, we have further built upon the theme through equity allocations to global energy refiners investing in renewable fuels (e.g., sustainable aviation fuel, renewable diesel), miners and refiners of industrial metals who lead in low carbon intensity production, and industrial companies exposed to the renewable revolution with large market share and pricing power. We expect the supply-demand fundamentals facing commodity markets to persist for many years, pressuring prices and having a negative impact on prevailing market sentiment, with a particular emphasis on long-duration assets. We will be hedging a portion of our equities exposure by betting against indices we find to be richly valued given our probability-weighted scenarios. We expect interest rates, especially in the developed world, to make higher highs and higher lows over the next few years, a quasi-mirror image of the lower highs and lower lows of the deflationary past few decades. Lastly, we believe that the currencies of commodity-exporting nations will benefit greatly from this scenario.
To arrive at these views, we have done extensive research that involves proprietary information and third-party data. If you are interested in a full copy of the report, please contact ir@norburypartners.com.
To conclude this series of Special Reports examining the 2020 United States election, we want to take a closer look at one of President-Elect Biden’s cabinet picks, what the selection could mean for sustainability and fiscal policy, and developments at the Fed regarding climate change. Part 1 detailed our probabilistic approach to predicting a Biden win, while Part 2 dug into his policy platform, fiscal approach, and where we could see bipartisan support (hint: tech antitrust).
Election Outcome
As a quick refresher, let us first level-set on how things have shaken out since November 3. In a pattern many analysts suspected would occur, Republican voters turned out en masse for in-person voting on Election Day, giving President Trump and other Republicans early leads at the polls, but as mail-in votes were counted across the country, President-Elect Biden edged into the lead in a handful of key states and two runoffs were set for the Georgia senate races. President Trump contested the election results in many states, but elections were certified, and electoral votes cast by each of the battleground states in question (Georgia, Pennsylvania, Wisconsin, Michigan, and Arizona), guaranteeing a Biden presidency.
In Georgia, two hotly contested senate races determined the final composition of the Senate. At the caucus level, the final tally now shows 50 Republicans and 50 Democrats, with both Messrs. Warnock and Ossoff defeating Republican incumbents. We wrote in our final update to investors on October 27 that there was a 66.1% chance of a Blue Wave in D.C., including the scenario in which we have arrived. A surprise double Democrat win has given the incoming administration (with the vice-presidential tiebreaker) the ability to freely legislate. Caucus moderates, like Independent Angus King from Maine, and centrist Democrats from states with more practical, fiscally conservative electorates will be critically important to the passing of any legislation and are likely to serve as a dampening mechanism against some of the more extreme agenda items coming from the party’s fringes. However, we do expect this split to result in a streamlined nomination process for executive branch members and judges – expediting the rate at which we expect to see implementation of the President-Elect’s policy platform.
President-Elect Biden’s Cabinet
Partisan gridlock aside, the executive branch is expected to leverage its powers to advance its policy agenda, thus rendering the members of Cabinet ever more important. As is tradition in the Cabinet Room of the White House, the President and Vice President sit at the middle of a long table, opposite one another, with the members of Cabinet (e.g., department heads) organized around the table according to the date the department was established (and de facto, by importance). To the right of the President, and first ranking department head, sits the Secretary of State. And to the right of the Vice President sits the second ranking department head, the Secretary of Treasury.
Mrs. Janet Yellen, the nominee for Secretary of Treasury, needs no introduction. In her acceptance speech, the former Fed chair pointed to five issues as part of her agenda within the Biden administration: (1) inequality, (2) stagnant wages for non-college graduates, (3) communities that have lost industry with no new jobs to replace it, (4) racial disparities in pay, jobs, housing, food security, and small business lending, and (5) a gender disparity keeping women out of the workforce. While opinions differ on how to interpret the data to either support or refute those positions, one thing is clear, Janet Yellen, who as Fed Chairwoman said it was in fact “her job” to discuss economic inequality before Congress, will be attempting to address income inequality in America that may likely be as bad, if not worse, than it was after the Gilded Age preceding the Great Depression.
The Secretary of Treasury is the lead go-between for the executive branch and Congress on matters of fiscal policy and budgetary spending. Yellen can be described as a progressive Keynesian, believing that government intervention should be utilized as necessary to restore full employment and demand. She is a stated supporter of broader unemployment benefits and has been characterized in the media as “pro-labor.” As Fed Chair, her monetary policy toolset was limited to interest rate control and quantitative easing – as she navigated the post-crisis period, she maintained low interest rates, encouraging employment but consequently also causing asset price inflation which in many ways exacerbated the inequality issue.
Stepping into her new role, Mrs. Yellen will have a wholly different set of levers to pull. With a second wave of Covid-19 spreading and vaccine rollouts being less successful than forecast, there is a good chance that as part of the follow-on coronavirus relief package to come after Inauguration Day, we see her reinstate the expanded unemployment benefits that expired last summer. She has also come out in favor of fiscal support for state and local governments, a contested view on Capitol Hill. She recognizes these entities as important employers, and notes that if they are not helped, there will be large layoffs and more difficult to solve problems in the future. It is important to remember that state and local governments are required to maintain balanced budgets and cannot raise money selling treasury securities like the federal government, meaning in times of low revenue (e.g., low sales tax revenue, low metro ridership), states and municipalities are required to cut costs (e.g., jobs, subway service). Abroad, she will be central to negotiating America’s position in trade deals, and as a believer in globalization, will likely be a measured, stark contrast to the outgoing administration. Finally, she has stated a desire to leave the system more guarded – the New York Times characterized it as, “putting training wheels on capitalism.” An example is her support for budgetary stabilizers, which would kick in when the economy declined and do not require Congress to vote and pass a fiscal package but would automatically increase unemployment benefits.
Given her background, we expect the Federal Reserve Bank and executive branch to be far more in sync, and for Mrs. Yellen, who has gone on record discussing how recent asset inflation has not carried over to working people, to be instrumental in shaping the country’s fiscal agenda.
Federal Reserve Joins NGFS
Last month, the Federal Reserve officially joined the Network of Central Banks and Supervisors for Greening the Financial System, a collection of central banks meant to exchange ideas and best practices to account for environment and climate risk in the financial sector. The Fed has recently began paying more attention to climate change and can thank former Chair Yellen for being the first Chair to begin examining the impact of broader economic and global issues on the financial sector. In April 2019, Mark Carney, former Governor of Bank of England and Chair of the NGFS, penned an open letter detailing four recommendations from the coalition’s first report seeking to translate commitments into action: (1) integrate monitoring of climate-related financial risks into day-to-day supervisory work, financial stability monitoring, and board risk management, (2) integrate sustainability into central bank portfolio management, (3) collaborate to bridge the data gaps to enhance the assessment of climate-related risks, and (4) build in-house capacity and share knowledge with other stakeholders on management of climate related financial risks. For a myriad of reasons, particularly given our investment strategy, it is both exciting and encouraging that the Federal Reserve is participating in the organization.
Together at the Group of 30, Yellen and Carney wrote that governments should treat climate change and fighting global warming like monetary policy, because both require considerable long-term decisions that can be undermined by short-term partisan pressures. Carney is pushing for all listed companies to report on their exposure to climate risks for by 2023 and substantiated his reasoning in a recent talk at the Dallas Fed. As governor of the BoE, he oversaw the insurance industry and noted that those who oversee property and casualty insurance, in addition to reinsurance, are keenly focused on climate change. Over the past decade they are consistently repricing coverage because, “what was once the tail has become the central scenario in terms of extreme weather events.” He went further to echo a sentiment we share, that it was necessary for the BoE to get involved in climate change because it was prudent responsibility. Ultimately they recommended a change to capital ratios for banks based off who they lent to – banks would be required to maintain greater reserves for lending to brown industries versus green. While on the surface this may seem partisan, it is important to recognize the following – as society slowly starts to more seriously consider these issues, climate policy will be stricter and banks could end up with very large stranded assets. As such, Carney believes that banks need to be stress tested for vulnerabilities associated with climate change in the same way they are tested for exogenous shocks after the 2008 crisis.
The United States still faces a myriad of threats: the Covid-19 pandemic, a sharp economic downturn, and attacks on its democratic institutions. In 1936, as Roosevelt accepted his party’s nomination in Philadelphia he said, “Governments can err, presidents do make mistakes, but the immortal Dante tells us that divine justice weighs the sins of the cold-blooded and the sins of the warm-hearted in different scales.” It is our belief that recent events have not created an irreversible rupture in the social fabric of this country, and its result will be one of compromise to the exclusion of extremists. Trump’s impeachment process could mark the start of a new era of bipartisan cooperation. Like Roosevelt, the new Democratic president has the opportunity to implement far-reaching reforms through a Green Bipartisan New-New-Deal that will reform the United States infrastructure, increase income distribution and maintain its strategic role in the world for decades to come. Combined with Janet Yellen’s penchant for fighting unemployment and inequality, and the Fed’s increasing posture on climate change, we think that 2021 can be a big year for sustainability and investments that incorporate such thinking. We hope you enjoyed your holiday season; our team is excited for what’s ahead and look forward to you reading our future commentaries.
This is the first piece in a series of Special Reports we will be writing on the 2020 US Elections. The first part of this report is a primer on US election cycles – if you are familiar with how the bicameral Congress and President are elected in the United States, please feel free to skip ahead to the second section of this report where we get into our detailed forecasts for this election cycle.
Background on US Elections
Every four years, the United States convulses in an extraordinary spectacle – a mixture of high policy disagreement (economic, foreign policy, national defense, taxation), frantic door-to-door canvassing, speeches at any podium a candidate can find, private appeals to donors both large and small, and the proverbial baby-kissing at every parade or state fair. For all that the process appears artificial or contrived and sometimes downright ridiculous and pandering, elections, as President Obama explained to the Republican Senate after declining to adopt any changes they proposed to his ObamaCare Act, “have consequences,” and these consequences can be serious for investors. As a result, we begin with a primer on the American federal election cycle.
Direct Elections (every 2 or 6 years)
Let’s begin with the most straightforward federal election cycle – the House of Representatives and Senate. There are 435 Congressional Representatives and 100 Senators.[i] The number of Representatives each state sends to Congress is a function of population size determined every ten years by a national census.[ii] The Senate is easier – each of the 50 states simply elects two senators. The number of Senators, as among the states, was intended to guard against the potential oppression resulting from population differences between any two states, like Montana and New York.
Both Congressional Representatives and Senators are elected the same way: by voters casting votes directly, either in-person or by absentee or mail-in ballots in each state, but the election cycles differ. The term of office for members of the House of Representatives is two years, with elections held both at the same time as the Presidential elections and halfway through the presidential term, in “mid-term elections.”[iii] This is a Constitutional requirement.[iv] Congressional Representatives are elected from districts in each state and are elected according to the count of the popular vote. Alternatively, senators serve for six years instead of two, and one-third of that body (Class I, II, and III) stands for election every two years, as per the Constitution.[v] Senators are also elected according to the results of the popular vote in each state. Since there are no federal term limits on elected service in Congress, and most incumbents, enjoying name recognition and franking privileges, are more likely to be re-elected, there is less turnover than one might expect in both houses.
One unfortunate effect of the short election cycles in the United States is that the election cycle has become dominated by the need to raise money. Congressional Representatives are widely understood to be in constant fundraising mode. This makes them susceptible to the corrosive effects of corruption and influence peddling, despite the strict laws that govern fundraising. Theoretically, the Senate, often termed the “millionaire’s club,” is less susceptible given the longer terms and that its members have traditionally possessed significantly greater wealth.
Indirect Elections (every 4 years)
The President of the United States (POTUS) is elected every four years, and this, by contrast to the direct elections decided by popular vote, is an indirect process. The votes to elect the POTUS are cast by the Electors of the Electoral College. The presidential election is held every fourth year on the first Tuesday after the first Monday in November.
Before we attempt to explain the Electoral College process, let us first review how one becomes a mainline presidential candidate. Candidates are selected in primaries that take place in each state and territory. Each party puts forward a slate of candidates for consideration by the voters registered as members of the said party – this year saw a particularly large number of potential Democratic Party candidates, ultimately resulting in the Biden-Harris ticket. The Republicans, holding the presidency, simply put forward the incumbent, President Trump, as a candidate for November 2020. Each party holds state-specific contests by which each candidate competes to win delegates who will then, theoretically, be pledged to vote for the selected candidate at the convention held by each party, usually in the summer before the November election. With the main party candidates selected by delegates at the convention, we can move on to the general election.
The selection of the POTUS is ultimately the task of the Electoral College. The Electoral College is not a physical place – it is a process overseen by the Office of the Federal Register, which coordinates certain functions of the Electoral College between the States and Congress. The Electoral College was created as a compromise in the United States Constitution between having a direct popular vote and a vote solely by the members of Congress. The College is made up of 538 Electors. The Electors are appointed from every state and from the District of Columbia in the same number as each state’s number of members of the House of Representatives and Senators (the census count thus becoming important again).[vi]
The vote cast by each person for President is actually a vote cast for a party’s slate of Electors on that first Tuesday following the first Monday of November every four years (or is a vote for the independent candidate’s Electors), even if it doesn’t appear that way on the ballot. Most states have a winner-take-all approach to the selection of the Electors, meaning that the competing Electors are selected according to the popular vote and the Electors associated with the winners of the popular vote become the Electors for each state (other than for Maine and Nebraska, which allows appointment according to the winner of each Congressional District and gives two electors to the winners of the state as a whole – allowing for split Elector distribution).
Each Elector is, without getting into the details, generally then going to vote for the candidate to whom that Elector was selected for. They are often required, either by state law or because of a pledge they made to the party when selected by the party as an Elector, to vote for the popular-vote candidate. Historically, over 99% of the pledged or promised Electors have voted as they had promised or pledged.
The popular election takes place, et voila, the media then reports (sometimes too early based on exit polling[vii]) who the next POTUS is. Formally, the world actually doesn’t know who the next POTUS is until January 6, after the Electors actually meet to cast their votes and after the Senate and the House of Representatives meet in joint session to count those Electors’ votes.
And that, in a nutshell, is how the Presidential election works in the United States. It may be confusing, it may result in legal challenges, it may even result in confusing explanations in major newspapers about the Electoral College and how it functions, and it may result in anguished cries about how the popular vote is disenfranchised, but you at least now have the facts to know how it works. Elections have consequences, but so do electoral processes. One thing that is helpful to understand about the United States’ process is that it has not, so far, resulted in riots or armed insurrection. Hopefully, that streak continues.
Norbury’s Presidential & Senate Forecasts
To arrive at our presidential election forecasts, we’ve split the states into three categories: one-party states where election history and recent polls point to a given win for either party, states generally regarded as “swing” by observers where we have assigned a 100% probability of either candidate winning based on our own analysis, and the remaining handful of battleground states where we have assigned various probabilities. With these projections, we are forecasting a 94% chance of a Biden presidency.
There are a handful of states on both sides of the aisle that nearly always vote a certain way. Two of the most obvious states are California and New York, where Democrats hold supermajorities in both state legislatures, and each of the past seven (eight in NY) presidential elections have gone blue. On the other side, there are historically red states with large poll disparities like Mississippi and South Carolina, where in each of the past 10 elections, both states have voted Republican. Altogether in this set of states, we count 20 states for President Trump totaling 126 electoral votes and 19 states for Vice President Biden, totaling 219 votes. A detailed list of these states can be found in Table 1 below.
The next set of states requires a more careful assessment to assign to any one candidate. The first of these states is Michigan, where we have assigned a win to Mr. Biden. Our first step was to find and assign a base rate for the probability of either candidate to win this state. We start from an understanding of the history of voting in that state. When looking back at the past twelve presidential elections, we see that the state has voted Republican 50% of the time and Democrat the other 50%. In 2016, the state voted Republican, electing President Trump by a margin of around 10,000 votes, which corresponds to 0.24% of voters[1]. Before 2016, Michigan had voted Democrat in six straight elections. Secondly, we aim to understand how new information can change our base rate. At the time of writing this letter, a weighted average of polls based on the quality of polls shows a 6.9% lead for Mr. Biden over President Trump in Michigan. This poll difference corresponds to more than two standard deviations beyond the margin of error. Combining this information, we are calling Michigan and its 16 electoral votes for Mr. Biden. A similar case can be made for nearby Minnesota, where the state has voted Democrat in each of the past 11 elections. To win the state, President Trump would need to turn approximately 45,000 voters (1.66% of voters1), but currently trails Mr. Biden by over three standard deviations (9.1%) in the aforementioned polls, and thus we are pledging the state of Minnesota and its 10 electoral votes to Mr. Biden. The last of the Midwest regional states in this part of the analysis is Wisconsin; in the previous election, President Trump carried Wisconsin by just under 23,000 votes or 0.82% of voters1. Like Michigan with whom they share a border, Wisconsin had elected seven straight Democrats before electing President Trump in 2016. At present, Mr. Biden enjoys a 6.7% lead in a weighted average of polls by quality, more than two standard deviations beyond the margin of error, and for this reason, we are calling Wisconsin and its 10 electoral votes for Mr. Biden. In New Hampshire, where Hillary Clinton won by 2,700 votes in 2016 (0.39% of voters1), Mr. Biden currently has a 9.5% lead in the aforementioned polls and the state has voted blue in each of the past four elections. With this in mind, we are forecasting New Hampshire and its 4 electoral votes to former Vice President Biden. Finally, we look at Texas, where polls have been historically tight between the two candidates. In 2016, President Trump carried the state by over 800,000 votes (9.43% of voters1) and the state has voted Republican in each of the past ten presidential elections. In the most recent weighted average of polls by quality, President Trump leads Mr. Biden by 2.3%, within the margin of error but gaining ground. Given the disparity in voter turnout in the last election and the historical significance of Texas’ Republican election history, we are currently assigning Texas and its 38 electoral votes to President Trump. Summing the results of our swing state convictions, the count is as follows: 40 additional electoral votes for Mr. Biden, adding to 259 total votes including the states from the first section, and 38 additional electoral college votes for President Trump, totaling 164 votes, including his states from the first section.
The seven remaining states totaling 115 electoral votes are: Arizona, Florida, Georgia, Iowa, North Carolina, Ohio, and Pennsylvania. Of these electoral votes, Mr. Biden only needs 11, a single-state win anywhere but Iowa, to assume the presidency while President Trump needs 106. In Arizona, former Vice President Biden would need to swing over 90,000 voters (3.78%1) from the 2016 election to win the state and while he currently leads in the weighted average polls, Republicans have been elected by the state of Arizona each of the past 5 presidential elections. This includes the last election cycle, where Hillary Clinton enjoyed a 3% lead in pre-debate polls and ultimately lost by 3.5% in exit polls; this is an indication that polls are not sufficiently reflective of the electorate in Arizona and as such, we are assigning a 15% probability of a Biden win in Arizona. Next is Florida, where Mr. Biden currently has a 2.9% lead in the polls, up from 2.2% last week; the last six elections in Florida have been split evenly between Democrats and Republicans. With President Trump having won by slightly more than 110,000 votes (1.24%) in 2016 and the electoral history of Florida, we are assigning a 50% probability of a Biden win in Florida. Onto Georgia, where polls are historically tight (current polls show a 0.6% Biden lead), but President Trump won by over 200,000 votes the last election. For Mr. Biden to win in 2020, he would need to swing over 5% of last election’s voters in a state that has voted Republican in each of the past 7 elections. Given historical precedent in the Peach State, we are assigning a 6% probability for Biden to win Georgia. In Iowa, where President Trump won by an astounding 150,000 voters (10.1%) in 2016, polls are showing him gaining ground. He is now 1.4% ahead of Mr. Biden in weighted average polls by quality, up from 0.4% last week. Although the past 6 elections have been split 50/50 between Democrats and Republicans, former Vice President Biden has a significant amount of ground to make up in 2020 and thus, we are assigning a 10% probability of a Biden win in Iowa. In North Carolina, where changing demographics are making a once-Republican stronghold an important battleground state, Mr. Biden currently enjoys a 1.4% lead in weighted average polls. Last election, President Trump carried the state by over 170,000 votes (3.81% of voters), but one of the two Democrats North Carolina has elected in the past twelve elections was President Barack Obama in 2008. With this in mind, we gave the chance of a Biden win slightly more weight and are assigning a 26% probability to Biden winning North Carolina. Next is Ohio, where like its midwestern neighbor Iowa, President Trump won in a landslide in 2016 (450,000 votes or 8.54%). Mr. Biden’s lead in weighted average polls has shrunk from 1.3% to 0.6% in the past week and the margin he needs to overcome is so wide that we are assigning a 15% probability to Biden winning Ohio. Finally, there is Pennsylvania, where before electing President Trump in 2016, the state had elected six straight Democrats. His margin of victory in Pennsylvania was less than 1% (about 45,000 votes) and Mr. Biden’s margin is currently 6%, twice the margin of error for polls. With this in mind, we are assigning a 75% probability of a Biden win in Pennsylvania.
By combining these probabilities, we arrive at a 94% probability that Mr. Biden wins the presidential race in 2020. Consequently, this means President Trump has a 6% chance of winning.
Turning to the Senate, where there are 35 seats up for election, the Democrats need to win 15 seats for a majority in the case of a Biden win (given the Vice President is the tiebreaker in the Senate) and 16 seats for an outright majority in the case of a Trump re-election. Using a similar framework to the presidential analysis, we use polls and historical data to make our forecasts and arrive at a result where 17 seats remain Republican and 11 Democratic. Interestingly, the leftover seats at the center of our election analysis all belong to incumbent Republicans and are from the following states: Iowa, Maine, North Carolina, Montana, Georgia (Class 2 seat), Colorado, and Arizona. By using data from the Good Judgment Project, we find that Democrats have: a 50% chance to win in Iowa, a 73% chance to win in Maine, a 66% in North Carolina, a 35% in Montana, an 83% chance to win in Colorado, and an 81% chance to win in Arizona. For the Class 2 seat in Georgia, incumbent Republican David Perdue finds himself in a historically tight election by Georgia standards and we see a 23% chance of a Democratic win.
Traditionally, the popular vote tends to be a good indicator of the composition in the House of Representatives. Given the current Democratic majority, consistency with which Representatives are re-elected, and Mr. Biden’s large lead in national polls, we are confidently forecasting a Democratic majority in the House.
Combining the senate probabilities with the presidential probabilities, we arrive at a 71% probability that Democrats achieve majority if only 15 seats are required, and a 37% probability if 16 seats are required. As it stands now, the combined probability of a Blue Wave, where the Democrats win control of Congress and the presidency, is 66.2%. Put in context, since 1972 (the past 12 presidential election cycles), the same party has controlled the House, Senate, and presidency only 25% of the time. Surely, the implications from a policy and governing perspective can be huge. We will be continuously updating these numbers in our weekly Special Reports on the 2020 US Election.
Possibilities Beyond Election Day
While we are forecasting a Biden win and a Blue Wave at the polls on Election Day, we are not ruling out the possibility of litigation or other issues past the day votes are cast; this particular election carries with it an enhanced risk of legal challenge. For different reasons, both parties are primed to think anything other than a clear landslide result will be something that may be tainted by fraud/suppression and will challenge that result. Under the circumstances where we are seeing problems with mail-in ballots and in-person voting due to the pandemic, it seems clear that we are at risk for a potentially sharp legal battle.
The most recent legal battle to look to for lessons is Gore v. Bush, when Albert Gore and the Democratic Party challenged the voting results in Florida which voted, apparently, in favor of George Bush. Voting laws are primarily creatures of state law and anyone who wishes to challenge the fairness of an election would start by filing in state courts in the state in which the challenge is to be lodged. However, and this is what we saw in Gore v. Bush, an aggrieved party at the state court level can apply to the United States Supreme Court for injunctive relief and to stay the state court proceedings. The Supreme Court has to first grant certiorari – in other words, accept the case. What may be different now is that liberal Justice, Ruth Bader Ginsburg, has recently died and the Court has not seated a replacement. This leaves the Court with 8 voting justices and while the Court could grant cert with just four votes, it may be deadlocked (4-4) on an eventual resolution of the full application. The deadlock would result in an effective denial of the application as the Court would not have a majority opinion.
This may be solved by quickly seating the current nominee – Amy Coney Barrett. The problem there is that the Senate must confirm her first and Republican Senators are currently testing positive for Covid-19, which may preclude their in-person attendance at the Senate to vote for her nomination. The margin for confirmation, assuming it goes by party vote, is narrow to begin with only 53 Republican Senators and 47 Democratic Senators (counting the two independent Senators who vote with the Democrats). Losing the attendance of four senators from the Republican side of the aisle could very well doom the Barrett nomination or at least delay it at a critical moment. This consequence of the pandemic – the inability to seat a judicial nominee – may have profound electoral consequences in ways no one could have imagined.
***
We appreciate you taking the time to read what we hope is the first of many commentaries on what we are seeing and learning. If you have any questions, please don’t hesitate to get in touch with one of us.
Sincerely,
The Norbury Partners Team
Table 1: “One-Party” States
Trump (Electoral Votes)
State
Biden (Electoral Votes)
9
Alabama
3
Alaska
6
Arkansas
California
55
Colorado
9
Connecticut
7
Delaware
3
District of Columbia
3
Hawaii
4
4
Idaho
Illinois
20
11
Indiana
6
Kansas
8
Kentucky
8
Louisiana
Maine
4
Maryland
10
Massachusetts
11
6
Mississippi
10
Missouri
3
Montana
5
Nebraska
Nevada
6
New Jersey
14
New Mexico
5
New York
29
3
North Dakota
7
Oklahoma
Oregon
7
Rhode Island
4
9
South Carolina
3
South Dakota
11
Tennessee
6
Utah
Vermont
3
Virginia
13
Washington
12
5
West Virginia
3
Wyoming
126
Total
219
Table 2: Current Norbury Projections
Trump (Electoral Votes)
State
Biden (Electoral Votes)
Michigan
16
Minnesota
10
New Hampshire
4
38
Texas
Wisconsin
10
38
Total
40
Table 3: Norbury Battleground State Probabilities
Trump (Probability)
State (Electoral Votes)
Biden (Probability)
85%
Arizona (11)
15%
50%
Florida (29)
50%
94%
Georgia (16)
6%
90%
Iowa (6)
10%
74%
North Carolina (15)
26%
85%
Ohio (18)
15%
25%
Pennsylvania (20)
75%
[1] that voted either Democrat or Republican (e.g., excluding Independent candidates)
[iv] Article I, Section 2, provides: “The House of Representatives shall be composed of Members chosen every second Year by the People of the several States. . .”
[v] Article I, Section 3, provides that: “[O]ne third may be chosen every second Year …”