Macro Minute: Fiscal Cliff vs. Excess Savings

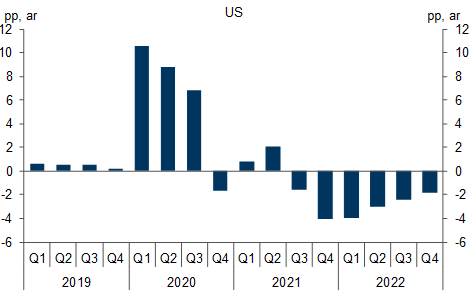
Looking ahead to 2022, much has been written about the pending fiscal cliff and its impact on Real GDP Growth. As the impact of fiscal stimulus dissipates and the federal government mulls tax increases, analysts expect fiscal impulse to shift from positive to negative next year.

Figure 1: Effect of Fiscal Policy on Real GDP Growth (3Q CMA) [Source: Goldman Sachs]

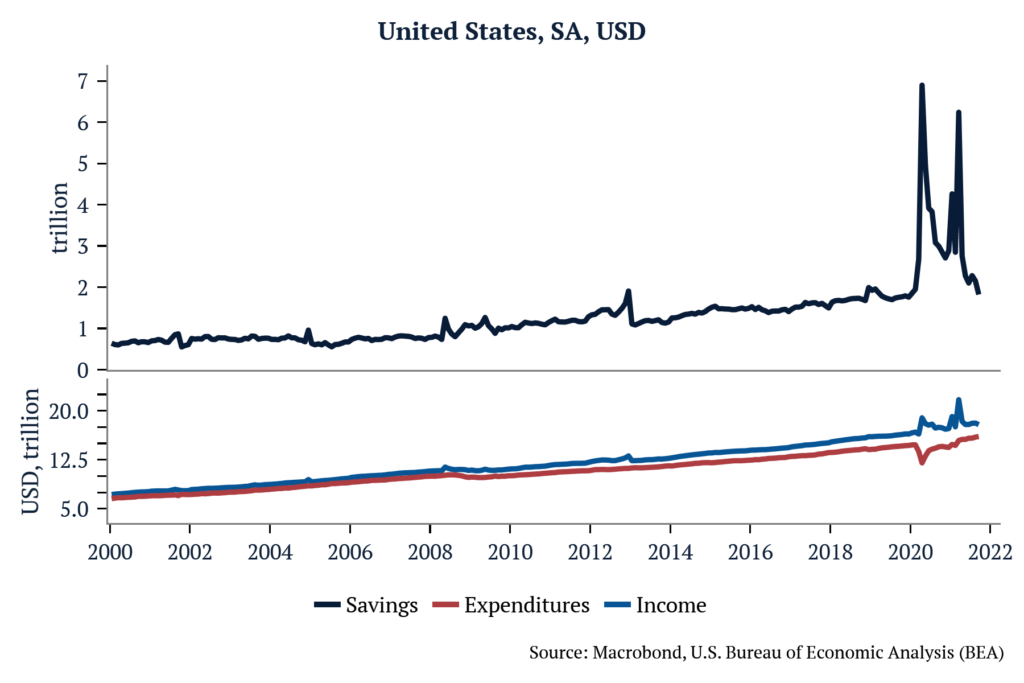
In our estimation, given the levels of excess personal savings reached in the past 20 months, we believe there is enough pent-up savings to compensate for the forthcoming negative fiscal impact on GDP. Using seasonally adjusted personal income minus personal consumption expenditures as a proxy for personal savings, we find that from April 2020 through September 2021, Americans generated over $2.8 trillion in excess savings, amounting to approximately 12% of GDP. That compares with approximately 4% of fiscal drag projected for 2022.

Macro Minute: What’s going on in the US Labor Market?

With job openings, participation rate, and unemployment central to the current discourse on markets, the topic of this month’s memo is the United States labor force.  

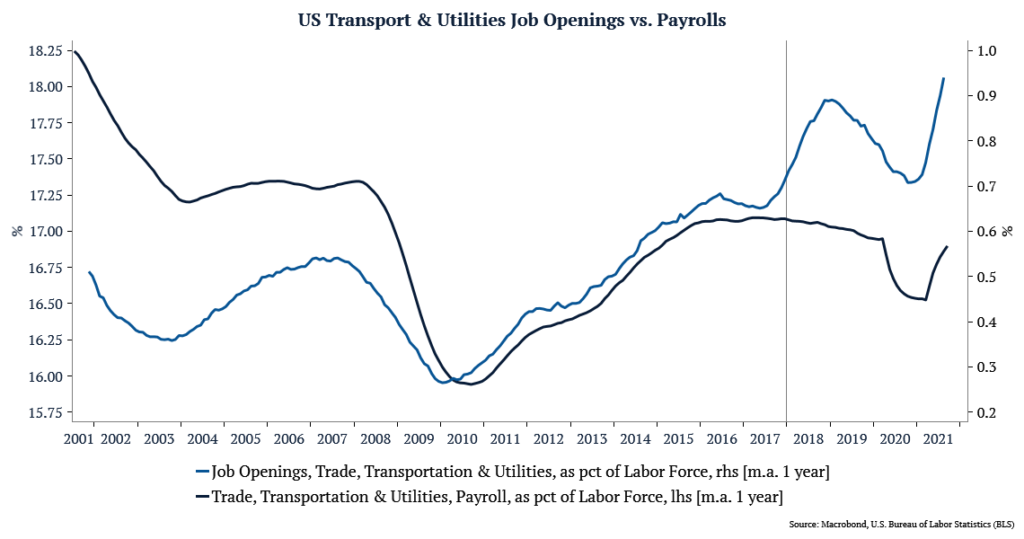
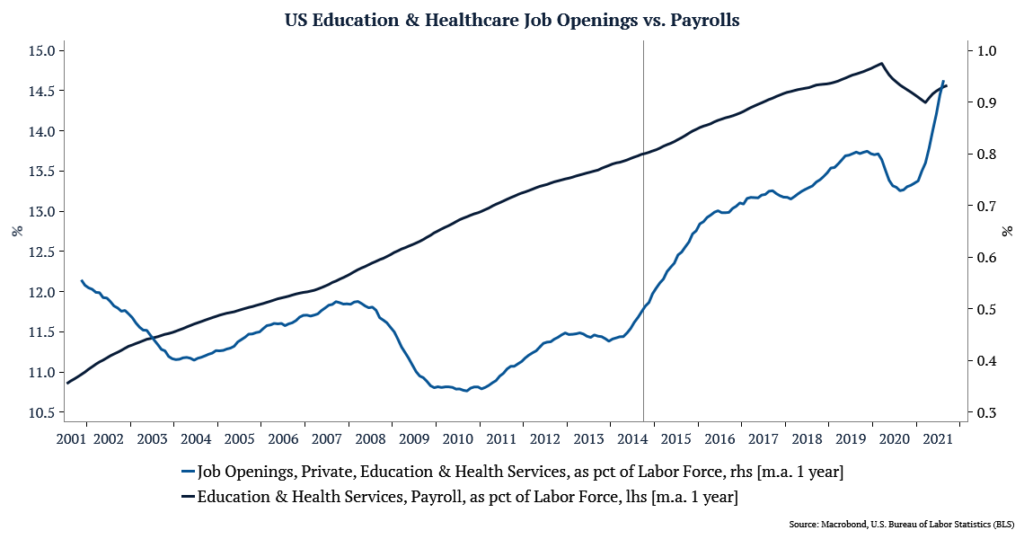
Focusing on the four largest sectors (which add up to more than 60% of payrolls and job openings in the US economy), we can see that wage inflation is a pattern that predates the onset of covid. In other words, wage inflation is not simply a result of covid supply shocks, it is based on fundamentals in the economy, and therefore it is not transitory. 

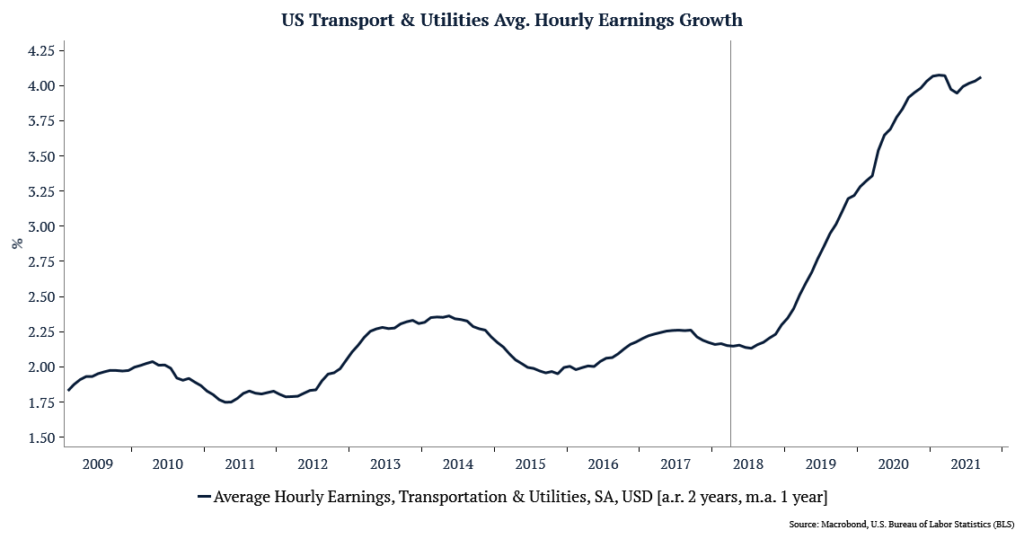
1 – Trade, Transportation & Utilities (19% of total Payrolls, 18% of total Job Openings)  In 2018, demand for work (job openings) started to grow much faster than supply (using payrolls as a proxy). As a result, average hourly earnings growth for this sector has surged from an average of 2.25% percent in 2018 to over 4% today (and 3.35% pre-covid). 

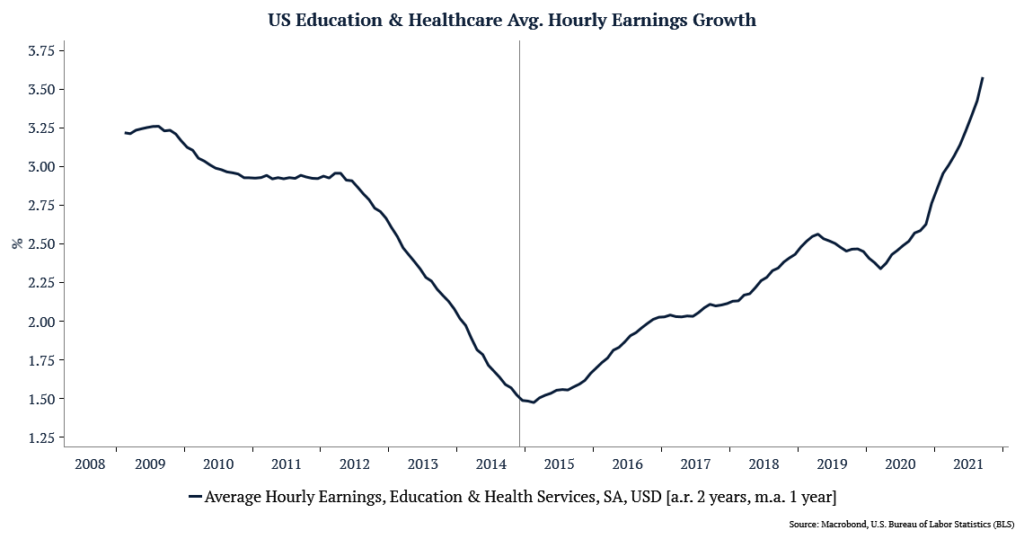
2 – Education & Health Services (16% of total Payrolls, 18% of total Job Openings) Hereto the story is very similar, but it started even earlier. In 2014, demand for work accelerated faster than supply of workers, driving an increase in earnings from 1.5% to 3.4% today (and 2.5% pre-covid).

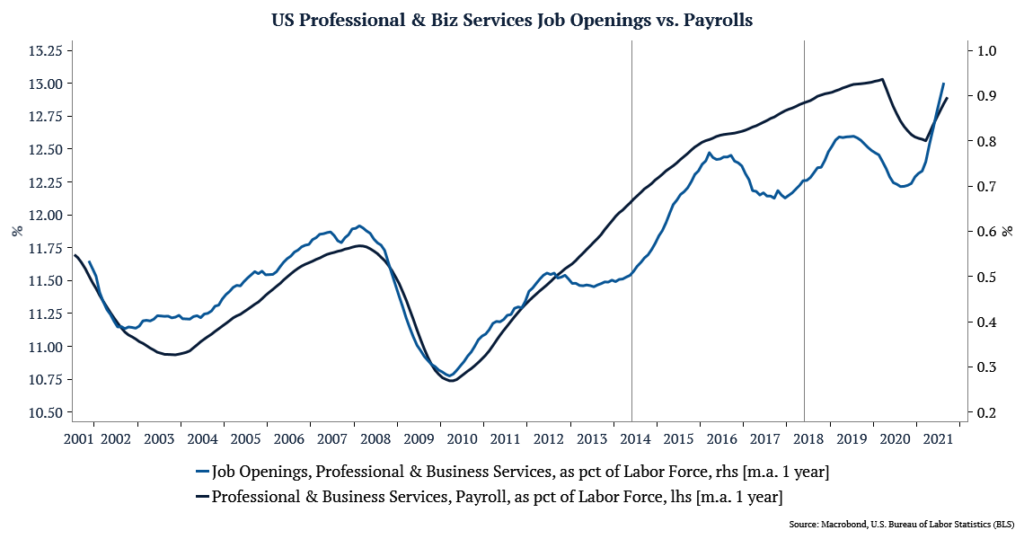
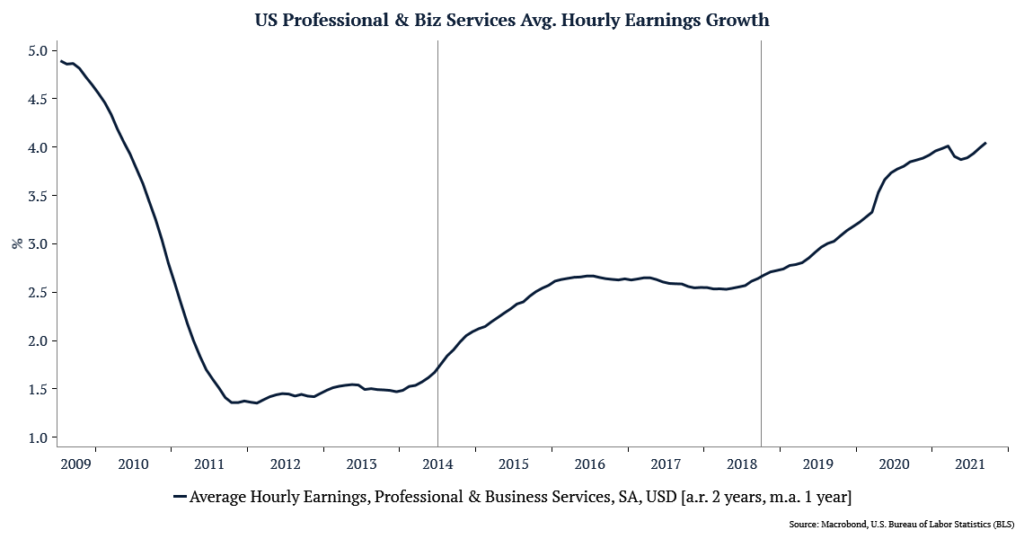
3 – Professional & Business Services (14% of total Payrolls, 18% of total Job Openings) In Professional & Business Services, we saw two waves. The first in 2014 and the second in 2018, causing an increase in earnings from 1.5% to 2.3% in the first wave, and from 2.3% to 4% today (and 3.3% pre-covid).

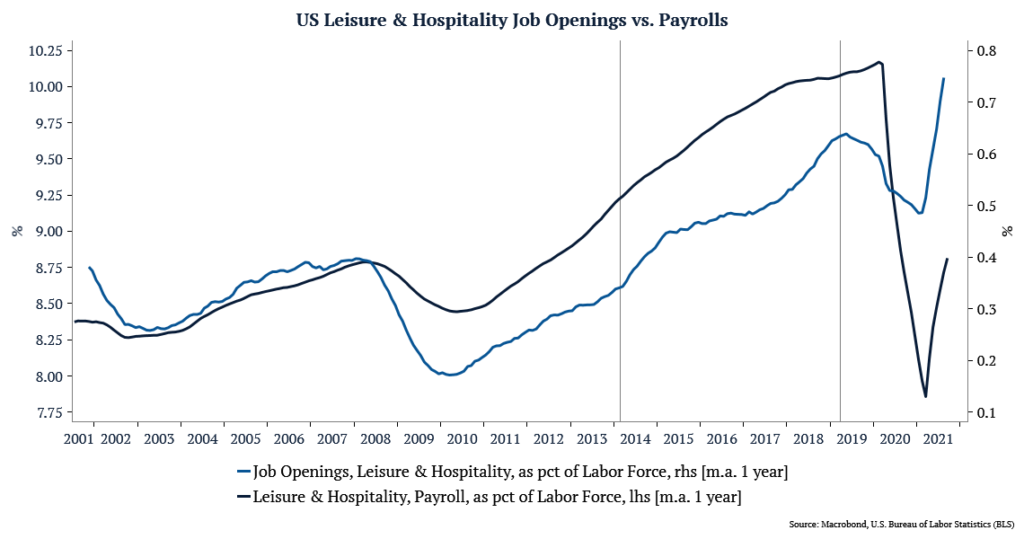
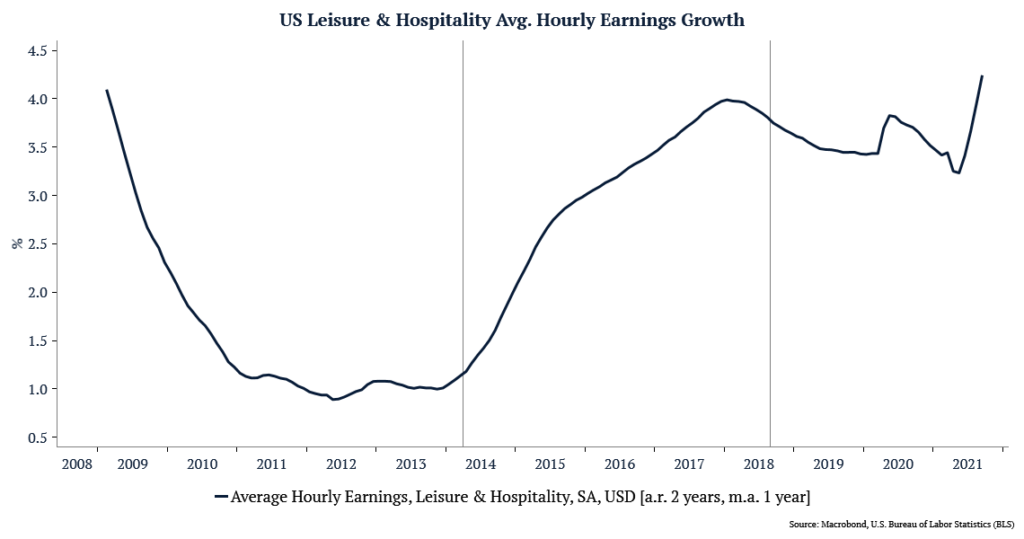
4 – Leisure & Hospitality (10% of total Payrolls, 14% of total Job Openings) Leisure & Hospitality is the only sector in the top 4 that has gone through two opposite cycles since 2014. The first was with the demand for work growing faster than supply starting in 2014, increasing earnings growth from 1% to 4% in 2017. The second cycle took place starting in 2018, with labor supply growing faster than demand, and earnings growth falling to 3.5%. Today we are back at 4% growth, last seen entering 2018. It is worth noting that today, the demand for work in this sector is at historical highs while supply is back near the levels of 2010.

Labor Supply Shock

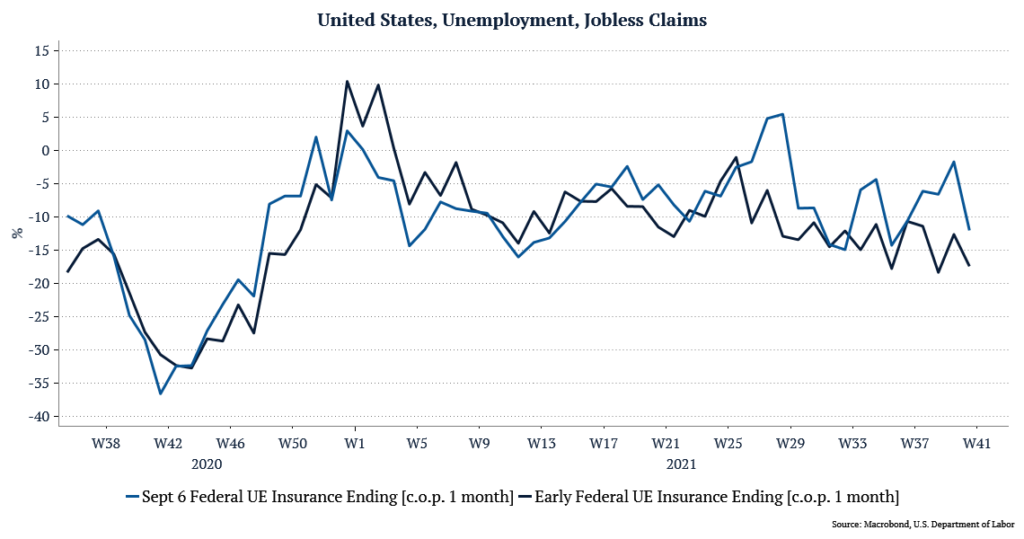
The last point has to do with the temporary labor supply shock that happened due to covid. Comparing jobless claims numbers between states that ended extra unemployment benefits before the September 6th deadline and those that adhered to the target, we see that the states that finished earlier have a much more accelerated and consistent contraction in claims across latter weeks. With this in mind, we expect some of this labor supply shock to normalize as we get farther from the deadline. However, when we look at the pre-covid trend, we believe that this will not be enough to avoid wage inflation.

Foreign Investment-Friendly Policies Could Make Brazil The Country Of The Present

“Brazil is the country of the future and always will be” is a quote often attributed to Charles de Gaulle that I particularly dislike but find hard to dispel.

From the early 1500s to 1930s, Brazilian GDP growth was merely a function of population growth, with annual population growth rates ranging between roughly 0.5% and 2%. It was only when government efforts to industrialize the country materialized in the 1940s that growth rates detached from population growth, with a meaningful increase in productivity that would only end with the hyperinflation period of the 1980s, resulting in a period of GDP per capita contraction. The seeds planted in the early years of industrial policy still pay dividends to this day through companies like Petrobras, Vale and CSN, as well as the National Bank for Economic and Social Development.

Until the 1970s, Brazil’s industrial policy was focused on opening its borders to attract foreign investment, which set it apart from many countries in Europe and Asia. The end of the expansion coincided with the oil embargo of 1973 and pushed the country into stagflation with high levels of debt and interest rates. It was only when the military dictatorship ended and democracy returned that the focus shifted to fighting inflation and economic development. By then, international competition was fierce, with China’s working-age population surpassing all developed markets combined. In many ways, the country was too early to reap the extraordinary benefits that globalization provided to emerging markets beginning in the 1980s. The disparity in emerging markets can be seen by comparing different countries’ economic complexity indexes. From 1998 to 2019, Brazil moved from 24th in terms of economic complexity to 49th in the world, while China impressively leaped from 72nd to 29th. The result was more successful in fighting inflation than implementing an effective industrial policy.

However, all is not lost. True, GDP per capita in Brazil was over nine times higher than in China in 1990, and in 2019 was about 85% the size of China’s, with expectations of decreasing further in the coming years. But, this loss in income has also made the country more competitive. Since 2011, labor costs in Brazil have decreased, and the OECD projects those costs to be slightly lower in 2022. In China, unit labor costs have steadily increased since the Great Financial Crisis and are materially higher than in Brazil at present, with projections implying further divergence between the two countries. When compared to Mexico, although labor costs are also trending down, Brazil still has one of the most cost-competitive labor markets in emerging markets today.

Along with cheaper labor costs, Brazil is in a great place to benefit from sustainability megatrends and international net-zero emissions goals. As the world moves toward net-zero, policies such as a carbon border adjustment tax are increasingly likely. Such a tax would mean that goods produced in countries where most of the electricity is generated from carbon-based fuels will cost more for producers, leading profits-first exporters to search for alternative manufacturing bases. Countries with mostly renewable electricity should benefit from significant capital inflows. Brazil generates 83% of its electricity from renewable energy, most of which comes from hydropower. The government has stated plans going back to 2016 to expand the share of renewable alternatives in its energy mix — wind has the greatest potential in the dry season as a hedge against low rainfall limiting hydropower productivity. Specifically, the 10-year Brazil Energy Plan from 2016 called for 18.5 GW of additional wind capacity by 2026. As of March, there was 17.7 GW of wind capacity installed in Brazil, leading it to be ranked eighth in the world for total wind capacity installed. This compares to China, India and Mexico, where only 29%, 22% and 21% of electricity production are from renewable sources, respectively.

Brazil still needs to improve its economy if it wants to compete with these countries to attract capital flows effectively. In 2020, the World Bank ranked Brazil 124th out of 190 countries regarding ease of doing business, compared to 31st for China and 60th for Mexico. Brazil ranked in the bottom third when it comes to registering property and starting a new business. The country was only better than six out of 190 countries when it comes to paying taxes, and ranked 170th for dealing with construction permits. By making even minor improvements, the region could be much more appealing to international investors. One place to start could be in reducing the administrative burden and time for companies to solve issues across these metrics, as this was a recurring theme in the data.

Historically, high interest rates have curtailed investments in Brazil. With rates materially lower, greenfield projects should be easier to pencil in the nation as companies look to diversify supply chains and protect their margins. This lower interest rate environment also opens new possibilities for industrial policies. Brazil could borrow a page from the Self-Reliant India playbook. The Indian government will spend $28 billion to subsidize manufacturing in the country by allowing manufacturers that hit investment and production targets to apply for cash back worth 4%-6% on incremental sales above their turnover for up to five years. This policy encourages foreign businesses to move manufacturing to India, produce goods for export and earn an incentive. This is not unlike the path China took to build its manufacturing base — initial Chinese export success relied heavily on foreign investment in clusters where domestic operators could grow alongside foreign competitors. Companies such as Apple, Amazon and a Foxconn subsidiary have already announced production plans in India. Such a foreign investment-friendly policy stance from Brazil could be monumental for the country’s manufacturing base and allow the country to emerge as a critical piece of a diversified, green global export regime.

If the country can seize this opportunity, it would finally put to rest the idea that success is an ever-moving target and make Brazil the country of the present.

Article also submitted to Forbes
2021 Annual Report

When observing macroeconomic trends, we separate our thinking between short-term credit cycles and the impulses impacting them versus slower-moving, long-term credit cycles and the prevailing policy drivers for their behavior. A tertiary layer that has been gaining steam for the better part of the past decade and is now firmly entrenched as a key driver of economic activity, market behavior, and our investment theses is sustainability. As we look ahead into 2021, we believe that we are at, or very near, a rare inflection point involving each of the three aforementioned factors that will reshape the landscape for investors globally. In the subsequent sections, we will discuss at length our views on each of these three pillars, but a summation of the key points can be found below:

  • The coronavirus pandemic caused the sharpest contraction of United States GDP and rise in unemployment of any recession since the Second World War, which resulted in an unprecedented level of fiscal and monetary support in most developed markets.
  • A combination of vaccination rates and the effects of the policy response has created an environment where cyclicals and services could benefit from the large increase in excess household savings and the most pent-up demand since the 1920s.
  • Commodities will play an important role in all of our investment horizons. In the short-term, supply-demand mismatch and supply chain disruption could provide upward pressure on the asset class, while rising oil prices might stymie consumers ability to spend on goods and services. In the medium-term, large increases in money supply used to finance government deficit spending could cause inflationary pressure to further increase commodity prices and in the long-term, government net-zero policies might result in higher carbon costs, which could raise soft commodity prices, as well as greatly increase demand for a new set of commodities integral to developing a clean energy complex.
  • Globalization has been driven by global demographic trends and trade policies since the 1980s that are slowly reversing due primarily to the working age population in China peaking last decade.
  • Labor market integration caused lower wage inflation which led to lower inflation globally. Central banks responded by progressively lowering interest rates, driving asset prices higher and causing balance sheets to expand rapidly relative to income.
  • Economic inequality across generations as voting demographics change in developed markets could lead to a redirection of capital and will influence the rate at which balance sheet issues are resolved.
  • Recent growth in sustainable and responsible investing strategies has been parabolic but encompasses a wide range of implementations. Limiting one’s investable universe through exclusion or negative screening reduces potential Sharpe ratios, while integrating material sustainability information as part of a holistic analysis of individual companies, countries, and commodities boosts them.
  • Given current government positioning, climate change mitigation and adaptation will likely be a key driver of secular trends for the coming decade. Large investments will be required to increase end-use efficiency and electrification of transportation and buildings, generate and transmit renewable energy, develop bioenergy and other carbon-free fuels, capture and store carbon dioxide, reduce emissions, and increase land sinks. Each of these verticals can shape the future path of equity, credit, and real asset prices if net-zero goals are to be met.

To arrive at these views, we have done extensive research that involves proprietary information and third-party data. If you are interested in a full copy of the report, please contact [email protected].