Macro Minute: Is Deep-Sea Mining the Answer?

For many decades now, world leaders have slowly come to terms with the realities of climate change. More recently, we have seen the public and private sectors starting to translate promises into actions through various investments. As we move from theory to practice, agents are beginning to run against obstacles that were not clear before.

It has become increasingly clear that the world lacks the investment in natural resources necessary to make the green energy transition a reality. Setting aside the requirements for building solar and wind power on a global scale, the Geological Survey of Finland (GTK) recently released a study examining the volume of metals needed to build the first generation of electric vehicles (e.g., replacing every vehicle in the global fleet today with one EV) and the power stations (e.g., batteries) necessary to store intermittent electricity generated from renewable sources. They estimate that one generation of electric vehicles (1.39 billion) will require over 280 million tons of minerals and another 2.5 billion tons of metals for power storage projects to support such an increase in electricity consumption. In sum, current estimates for global reserves of nickel, cobalt, lithium and graphite are not sufficient to support such a massive undertaking.

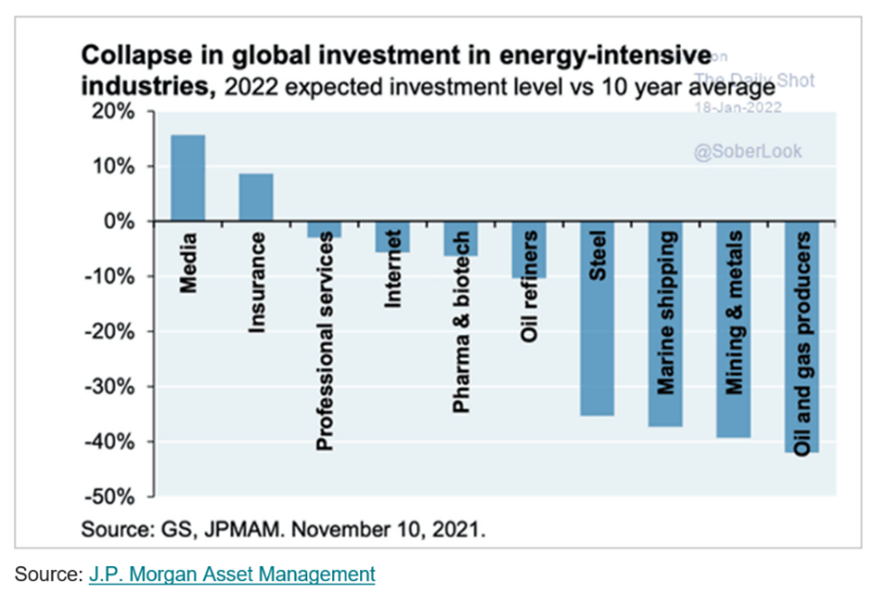
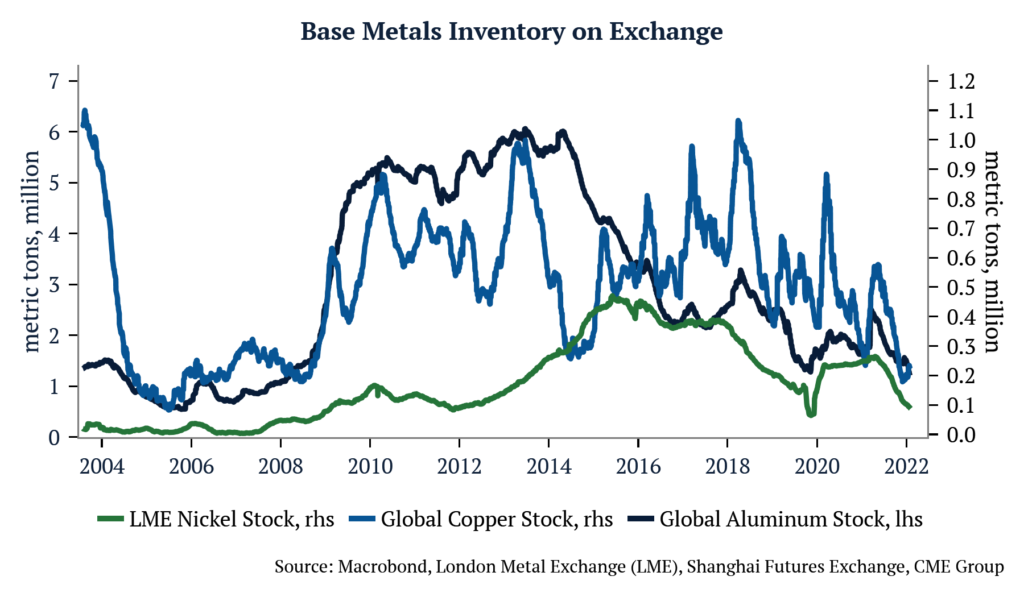
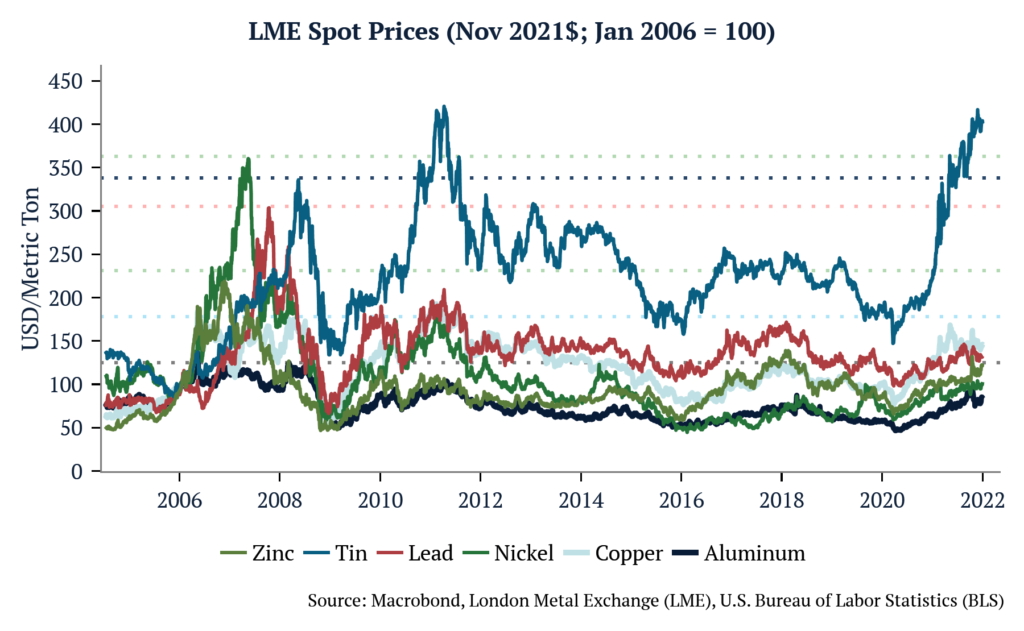
To aggravate the problem, investments to transform reserves into actual ore are faltering. Existing mines for copper in places like Chile have under-produced expectations meaningfully this year. Reports from the recent 121 Mining Conference in Sydney highlighted the issues of getting new projects approved and on track for production, characterizing the challenges as “multiplying” for myriad reasons, including higher interest rates, low and volatile mineral prices, and ESG concerns.

On the geopolitical front, the ongoing realignment of world power will also have a material impact on access to materials and their ESG qualities. The world’s largest nickel producer is Indonesia, where mines are developed in the most biodiverse biome on the planet—rainforests; its biggest and cheapest nickel operation is Nornickel, located in Russia. The world’s largest cobalt producer by far is the Democratic Republic of the Congo (DRC), where not only does the climate range from tropical rainforest to savannahs, but also the exploitation of child labor is a major social concern. While China is responsible for 64% of graphite mining, it also has a controlling interest in much of the DRC’s cobalt production, and maintains an overwhelming majority of the refining capacity for lithium, nickel sulfate, manganese and graphite.

The unprecedented demand for green-transition minerals meets a supply picture that is very constrained and will generate prohibitive costs to the energy transition. That happens while billions of people lack cost-effective access to the energy they need to prosper.

Deep-sea mining offers a very interesting alternative to this problem. The USGS estimates that the Clarion-Clipperton Zone, “the largest in area and tonnage of the known global nodule fields,” contains 21.1 billion tons of dry nodules. Based on that estimate, tonnages of many critical metals in the CCZ nodules are greater than those found in global terrestrial reserves. Given the high ore grades found in nodules, and the simplicity of recovery, many companies in the space estimate that deep-sea nodule recovery will be one of the lowest cost producers of critical minerals in the world. The same USGS publication mentioned above notes, “if deep-ocean mining follows the evolution of offshore production of petroleum, we can expect that about 35–45 percent of the demand for critical metals will come from deep-ocean mines by 2065.”

Like any extractive activity, this kind of endeavor also carries costs along with its benefits. However, their costs are different from what one would think at first. The vanguard of deep-sea mining does not involve drilling and mining pits. Instead, it is focused on the harvesting of nodules. Nodules are fist-sized lumps of matter that collect on the ocean floor over thousands of years when currents deposit mineral sediments. Different parts of the ocean contain nodules rich in different elements. Those found in the Pacific Ocean have been shown to contain incredibly rich deposits of copper, nickel, cobalt, and manganese with ore grades superior to many, if not all, of today’s land-based reserves. Nodule collection occurs between 4,000-6,500 meters in the aphotic zone where sunlight does not penetrate and biodiversity is faint. Its process is minimally invasive and entails the scraping of about 6 inches of the ocean floor to separate nodules from sediment, depositing most of what is not used back to its original place. MIT researchers recently published results of a study demonstrating that 92% to 98% of the sediment either settled back down or remained within 2 meters of the seafloor as a low-lying cloud. The plume generated in the wake of the collector vehicle stayed roughly in the same area rather than drifting and disrupting life above.

The benefits are potentially many. From an environmental point of view, this process has enormous advantages when it comes to the impact on deforestation, destruction of carbon sinks, and water usage. From a social aspect, deep-sea mining also appears to be superior to other extractive activities on land, with limited exposure to the negative social dynamics of social displacement, corruption and child labor. If proven to be cost-efficient, it would also promote clean and cheap energy creating prosperity for billions of people. Should the environmental studies of nodule collection continue to be positive, nodules present a promising alternative to solve our natural resource problem in the face of a green transition. As the West looks to become both greener and less dependent on “unfriendly” sources of labor and natural resources, it must take a pragmatic approach toward deep-sea mining, recognizing that there is no such thing as a perfect solution, but this could be the next best thing for achieving the future we want.

This article appeared on Forbes.

Macro Minute: Dollar dollar bill, y’all

This past Friday, September 9th, Bill Dudley was on air early morning making the case that the Fed wants a strong dollar. We know very well why the Fed needs a strong dollar. We wrote on July 25th about the relationship between inflation expectations and the currency’s strength:

“The DXY Dollar index is more than 17 percent up YoY, while the US CPI is 9.1 percent. Being conservative, we can assume a short-run currency passthrough in the US at about 25 percent. This means that if the US Dollar was flat year-over-year, inflation should be a whopping +13%! This blind faith in central banks is what is keeping everything together.”  – Macro Minute: We Learn From History That We Do Not Learn From History. July 25th, 2022.

However, how long the Fed can enjoy this position is less clear. Free-floating exchange rates, as opposed to the traditional view that expects a move to equilibrium at fair value, are inherently unstable. The reason for that is the reflexive nature of exchange rates. A change in exchange rates affects inflation, interest rates, economic activity, and other fundamental factors that then have an impact on exchange rates. This effect creates self-reinforcing and self-defeating processes that are very pronounced in currency markets.

In the case of the US dollar today, the fundamentals and nonspeculative transactions point in the direction of depreciation. It is only when looking at speculative transactions that we can find an explanation for the strength of the dollar in the past 12 months. In reality, the classification of speculative and nonspeculative is much more subtle, but for the purposes of this analysis, a simplified version of the model should suffice.

Non-speculative capital flows arise from the need (not the choice) to buy or sell dollars. On this account, all the fundamentals point towards the depreciation of the US dollar. The need to finance the US twin deficits is not new, but it has increased meaningfully recently. But one component in particular is seeing the largest changes- the need for USD in commercial transactions. Charles Gave, co-founder of Gavekal, wrote an excellent piece on “Network Effects and De-globalization.” In it, he proposes that reserve currencies benefit from the network effect, and that the turning point for the demand for US dollar transactions happened when the US insisted upon oversight of all US dollar transactions anywhere in the world. He argues that the catalyst for accelerating the contraction of this network was the US sanctioning Russian assets earlier this year. This decline has so far been masked by an increase in demand for USD coming from the energy crisis in Europe. We agree with that analysis and we can see the relationship between natural gas prices in Europe and the EURUSD (inverted axis) pre and post-mid-2021 below.

Speculative capital, on the other hand, is attracted by rising exchange rates and rising interest rates. Of the two, exchange rates are by far the most important. It does not take very large movements in exchange rates to render the total return negative. In other words, speculative capital is motivated by expectations of the exchange rate, a reflexive process. And when markets are dominated by speculative flows, they are purely reflexive. This is a very unstable situation. The self-reinforcing process tends to become vulnerable the longer it lasts, and it is bound to reverse itself, setting in motion a process in the opposite direction.

This is an obviously oversimplified model, but it brings useful conclusions. When the inflow of speculative positions cannot keep pace with the trade deficit, rising interest obligations, and lower demand for trade in US dollars, the trend will reverse. When that happens, the reversal may accelerate into freefall, as the volume of speculative positions is poised to move against the dollar not only on the current flow, but also on the accumulated stock of speculative capital. Lastly, when that happens, the exchange rate will have an impact on fundamentals (inflation and inflation expectations) which in turn will have an impact on exchange rate expectations in a self-reinforcing process. All of this will make the Fed’s job that much harder.

Given the unpredictable nature of speculative flows and self-reinforcing trends, we can’t say for certain when this will happen, but if pressed for an answer, I would say in the next 9 months. If the US dollar maintains or accelerates its trend during this period, the EUR would have to be trading below 0.86, the JPY above 170, and GBP below parity. And if it doesn’t, the reversal would be dramatic, if not catastrophic.

Macro Minute: The Russian Gambit

Last week, the European Union announced plans to ban Russian crude oil over the next six months and refined fuels by the end of the year as part of the sixth round of sanctions. Over the weekend, the proposed ban on its vessels transporting Russian oil to third-party countries was dropped, but the EU will retain a plan to prohibit insuring those shipments. Bloomberg reports that about 95% of the world’s tanker liability cover is arranged through a London-based organization that must heed European law. Without such insurance, Russia and its customers would have to find alternatives for risks, including oil spills and mishaps at sea, that can quickly run into multi-billion-dollar claims. (For more on the commodity trading business and how insurance impacts commodity flows, listen to “Javier Blas Explains How Commodity Trading Shops Really Work” on the Odd Lots Podcast).

The pain to European consumers is clear. The region last year got 27% of its oil imports and approximately 40% of gas from Russia (paying $104 billion for supplies of fossil fuels). Economists estimate a full embargo on Russian oil and gas reduces the area activity from 4% (Barclays) to 2% (Bundesbank), while some analysts have argued that the impact would be lower than that. Germany’s vice-chancellor Robert Habeck said his nation has already cut its reliance enough to make at least a full oil embargo manageable with the share of Russian crude in German imports falling to about 12% since the invasion.

For Russia, an oil embargo would limit the inflow of foreign currency and make difficult spending cuts necessary. Russia’s Finance Ministry expects its GDP to shrink as much as 12% this year, on par with the turmoil seen in the early 1990s, when the Soviet Union ultimately dissolved. On Monday, Russia said it expects its oil production to rise in May, and that it is seeing new buyers for its crude, including in Asia. But how much of this is true and how much of it is just posturing?

Changing oil shipping routes from Europe to Asia is not as trivial as Russia would lead us to believe. Different vessels are required to efficiently transport oil on different sea routes. When done properly, transport of crude oil by tankers is second only to pipelines in terms of efficiency, with the average cost of transport at $0.02 to $0.03 per gallon. When transporting oil, there are three main types of vessels: Very Large Crude Carriers / Ultra Large Crude Carriers, Suezmax, and Aframax vessels. There are about 800 VLCCs/ULCCs in the world used for long-haul routes and they carry around 2 million barrels each. There are about 700 Suezmax vessels capable of passing through the Suez Canal in a laden condition, and they can carry around 1 million barrels on long-haul routes. Lastly, there are about 600 Aframax carriers in the world, known as “go-fast boats,” moving about 600,000 barrels on short-haul routes.

Zoltan Pozsar of Credit Suisse estimates that roughly 1.3 million barrels of oil get shipped from Primorsk and Ust Luga to Europe on Aframax carriers and these journeys take a week or two to complete. Russia does not have pipelines to Asia so the only way to sell its product to new buyers is by using sea routes. However, it is uneconomical to transport crude on long-haul voyages on Aframax carriers and they would need more VLCCs/ULCCs to make that happen. Because Russian ports are not deep enough to dock VLCCs/ULCCs, they would first need to use Aframax vessels to get to a port to then transfer the crude to larger vessels. This transfer itself can takes weeks. After the transfer, the larger vessel would then take about 70 days to get to Asia, unload, and take a similar amount of time to return. This compares with just a couple of weeks when shipping to Europe. This would cause a sharp slowdown in Russia’s economic activity. The world would also need an extra 80 VLCCs/ULCCs to accommodate that change which represents 10% of the current global capacity of those vessels. Additionally, this only accounts for the re-routing of one product, oil, but Russia exports every major commodity.

The increasing competition for selling oil in Asia would have an impact on one of the Middle East’s biggest consumers. It is then no surprise that Saudi Arabia cut oil prices for Asia buyers over the weekend. This will not make Russia’s situation any easier. China benefits when Russia becomes weaker and more isolated and hence more dependent on Chinese goodwill. Let’s not forget that during Russia’s invasion of Crimea in 2014, China got Russia to agree to build (and possibly pay for) a dedicated pipeline at lower prices than it sells to Germany, even when the cost of gas from the new field is higher.

The cost of banning Russian oil might be large for Europe, but it can be even larger for Russia. This should increase the impact of sanctions and diminish the possibility of a unilateral cut in supply in the near future. 

Macro Minute: Commodities in 2022

After a strong year, we believe 2022 is shaping up to be another good year for commodities. The theme across most sectors in the asset class is consistent – a fundamental mismatch between supply and demand is driving prices higher. Prices are being further pressured by increasing costs of capital for some (e.g., energy producers), higher input costs for others (e.g., fertilizer for agricultural products), and/or after a decade of underinvestment, a lack of new projects ready to boost supply (e.g., base metals mines). Any weakness in a historically strong USD will further the dollar-denominated sector’s move higher.

Looking across the asset class, one finds inventories of many commodities well below their 5-year averages entering 2022.

Concurrently, JP Morgan projects global investment in commodity sectors to be the lowest across all sectors this year. This comes at a time where the forces of ESG have driven costs of capital higher, leading major producers of commodities to hold off on investing until higher prices are sustained for a longer period.

Fundamentally, physical assets are driven by volumetric levels rather than expectations, which fuel financial assets. When supply cannot meet demand, and inventories cannot bridge that gap, only the highest bidders get access to a specific commodity. This process is called “demand destruction” and can produce parabolic price movements.

This past year, we saw an example of “demand destruction” price action in European natural gas (TTF). Weather seasonality impacted a very inelastic demand while shifting energy priorities related to net-zero goals, and regional geopolitics caused a shift on the supply side.

We expect to see more demand destruction across the commodities complex in 2022.

Macro Minute: Commodity Inventories

A quick note on commodities… Historically tight inventories have led to all six base metals (Aluminum, Copper, Nickel, Lead, Tin, Zinc) listed on the London Metals Exchange to trade in backwardation for the first time since 2007.

Of those six, some of the tightest markets are in Aluminum, Copper and, especially, Nickel, which has the largest deficit in its history. Using the average daily production of each metal and aggregate inventories across Shanghai, London, and United States metal exchanges, we estimate global aluminum inventories to be approximately 5.8 days of production, copper at 2.2 days of production, and nickel at just under 13 days of production. Actual daily draws from exchange are variable, but this illustration speaks to the level of tightness in the market.

All but tin have upside to the levels reached in the last period of backwardation across the sector, after adjusting metal prices for inflation.

Bear in mind that while the price run-up in 2007 was also the result of a supply shock, albeit for different reasons, there was a sharp decline in demand caused by the bursting of the housing bubble and onset of the Great Financial Crisis, just as more supply began to come to market. The setup this time appears to be different. Persistent underinvestment in commodity extraction over the past decade, coupled with increased demand driven by government net-zero goals rather than private industry (e.g., homebuilders), suggest that this rally could be much tighter for much longer. With EV penetration increasing around the world, including in China, where nearly 20% of new car sales are electric, and the fact that those vehicles require between 5-6x more metal than internal combustion engines, we could see pressures drive prices past 2007 levels.